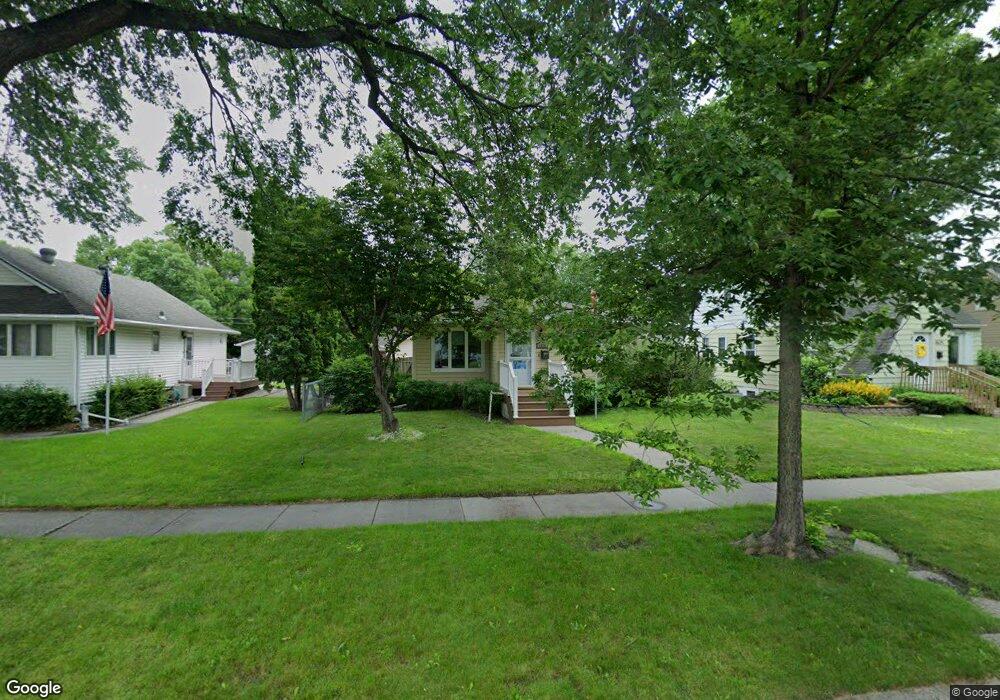
1529 7th St N Fargo, ND 58102
Washington NeighborhoodEstimated Value: $286,000 - $304,304
4
Beds
2
Baths
2,560
Sq Ft
$116/Sq Ft
Est. Value
About This Home
This home is located at 1529 7th St N, Fargo, ND 58102 and is currently estimated at $296,826, approximately $115 per square foot. 1529 7th St N is a home located in Cass County with nearby schools including Washington Elementary School, Ben Franklin Middle School, and North High School.
Ownership History
Date
Name
Owned For
Owner Type
Purchase Details
Closed on
Aug 26, 2020
Sold by
Finseth Danny and Finseth Mary Moen
Bought by
Watt Lowell A and Watt Brenda
Current Estimated Value
Home Financials for this Owner
Home Financials are based on the most recent Mortgage that was taken out on this home.
Original Mortgage
$236,700
Interest Rate
2.9%
Mortgage Type
Future Advance Clause Open End Mortgage
Create a Home Valuation Report for This Property
The Home Valuation Report is an in-depth analysis detailing your home's value as well as a comparison with similar homes in the area
Home Values in the Area
Average Home Value in this Area
Purchase History
| Date | Buyer | Sale Price | Title Company |
|---|---|---|---|
| Watt Lowell A | $263,000 | Regency Title Inc |
Source: Public Records
Mortgage History
| Date | Status | Borrower | Loan Amount |
|---|---|---|---|
| Closed | Watt Lowell A | $236,700 |
Source: Public Records
Tax History Compared to Growth
Tax History
| Year | Tax Paid | Tax Assessment Tax Assessment Total Assessment is a certain percentage of the fair market value that is determined by local assessors to be the total taxable value of land and additions on the property. | Land | Improvement |
|---|---|---|---|---|
| 2024 | $3,869 | $132,350 | $20,050 | $112,300 |
| 2023 | $3,619 | $123,700 | $20,050 | $103,650 |
| 2022 | $3,608 | $121,250 | $20,050 | $101,200 |
| 2021 | $3,365 | $114,400 | $20,050 | $94,350 |
| 2020 | $3,182 | $108,950 | $20,050 | $88,900 |
| 2019 | $3,006 | $108,950 | $11,900 | $97,050 |
| 2018 | $2,629 | $97,550 | $11,900 | $85,650 |
| 2017 | $2,438 | $91,150 | $11,900 | $79,250 |
| 2016 | $2,590 | $82,850 | $11,900 | $70,950 |
| 2015 | $2,743 | $82,850 | $8,150 | $74,700 |
| 2014 | $2,737 | $79,650 | $8,150 | $71,500 |
| 2013 | $2,664 | $75,850 | $8,150 | $67,700 |
Source: Public Records
Map
Nearby Homes
- 1626 Broadway N
- 1437 Broadway N Unit 102
- 1645 Broadway N
- 1610 9th St N
- 3216 Broadway N
- 1538 10th St N
- 1625 11th St N
- 917 14th Ave N
- 1633 3rd St N
- 1626 11th St N
- 1346 9th St N
- 314 18th Ave N
- 1316 8th St N
- 1822 3rd St N
- 1357 12th St N
- 1261 4th St N
- 1261 10th St N
- 1329 12th St N
- 1914 9th St N
- 1249 4th St N