
Landlord's Agent in 2025
Violet Jaworska
Baird & Warner
(312) 282-7862
1 in this area
39 Total Sales
Estimated Value: $396,031 - $426,000
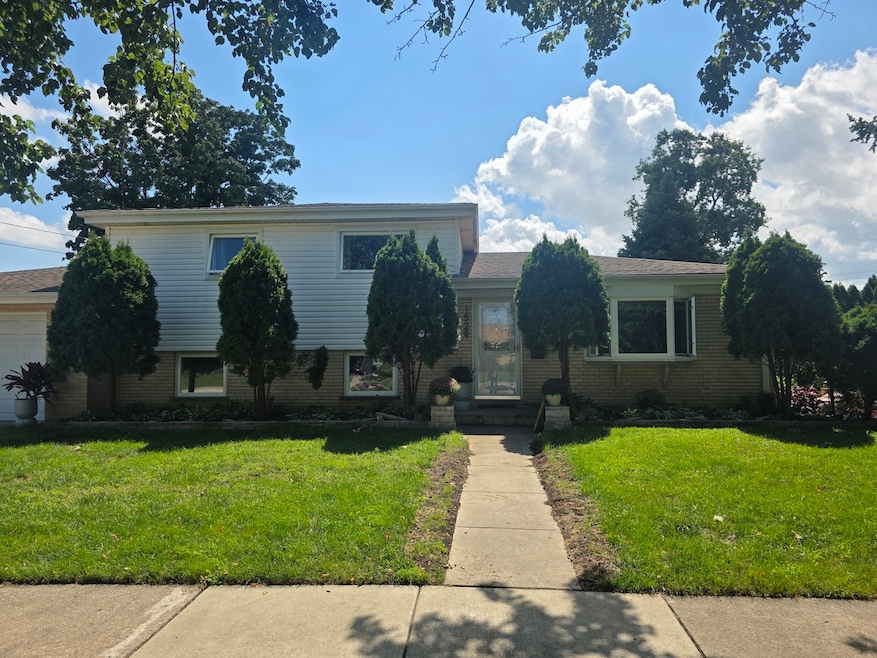
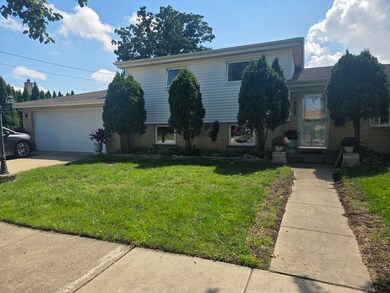
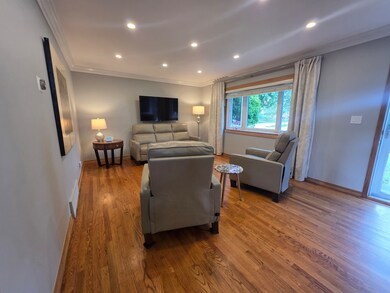
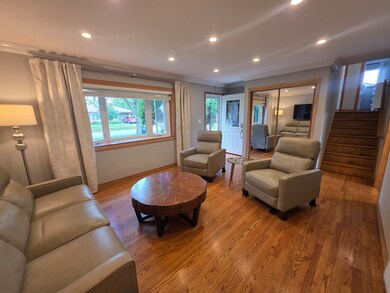
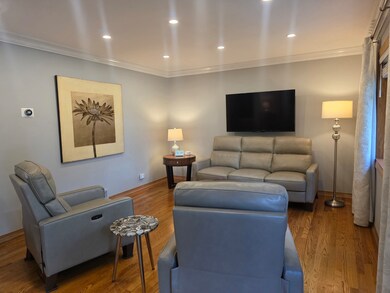
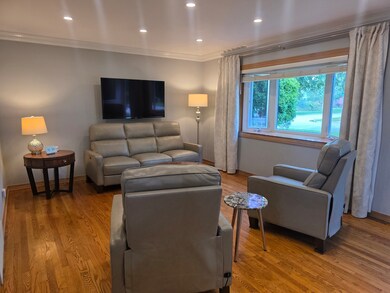
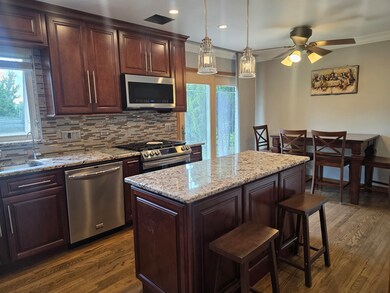
Lovely brick split level home on a corner lot, completely updated, flooded with natural light, large new kitchen with space for a dining room table boasts granite counter tops, 42 inch cabinets, island and SS top of the line appliances, hardwood floors throughout; three spacious bedrooms with large closets, completely updated bathroom with a large luxurious tub; downstairs features a newly remodeled great family room with a fire place; second bathroom and a laundry room; two car garage and a beautifully landscaped front and back yard with complete privacy makes it a urban oasis; private garden for your organic veggies and flowers; close to public transportation, expressway, shopping and great schools makes this an ideal location; available completely furnished
Last Agent to Rent the Property
Baird & Warner License #475151122 Listed on: 09/09/2025
| Date | Buyer | Sale Price | Title Company |
|---|---|---|---|
| Twin Beans Llc | -- | Fidelity National Title | |
| Community Savings Bank | -- | Chicago Title Insurance Comp | |
| Kornas Zbigniew | $292,000 | Chicago Title Insurance Comp | |
| Perez Roberto | $172,000 | Republic Title Company |
| Date | Status | Borrower | Loan Amount |
|---|---|---|---|
| Previous Owner | Kornas Zbigniew | $187,000 | |
| Previous Owner | Perez Roberto | $163,400 |
| Date | Event | Price | List to Sale | Price per Sq Ft |
|---|---|---|---|---|
| 10/22/2025 10/22/25 | Rented | $3,200 | 0.0% | -- |
| 09/09/2025 09/09/25 | For Rent | $3,200 | -- | -- |
| Year | Tax Paid | Tax Assessment Tax Assessment Total Assessment is a certain percentage of the fair market value that is determined by local assessors to be the total taxable value of land and additions on the property. | Land | Improvement |
|---|---|---|---|---|
| 2025 | $6,600 | $37,000 | $6,373 | $30,627 |
| 2024 | $6,600 | $31,000 | $5,665 | $25,335 |
| 2023 | $3,125 | $31,000 | $5,665 | $25,335 |
| 2022 | $3,125 | $31,000 | $5,665 | $25,335 |
| 2021 | $3,635 | $19,318 | $4,602 | $14,716 |
| 2020 | $3,963 | $19,318 | $4,602 | $14,716 |
| 2019 | $4,115 | $21,465 | $4,602 | $16,863 |
| 2018 | $5,458 | $21,686 | $4,071 | $17,615 |
| 2017 | $5,379 | $21,686 | $4,071 | $17,615 |
| 2016 | $5,332 | $21,686 | $4,071 | $17,615 |
| 2015 | $5,269 | $20,051 | $3,540 | $16,511 |
| 2014 | $5,843 | $22,312 | $3,540 | $18,772 |
| 2013 | $5,680 | $22,312 | $3,540 | $18,772 |
Landlord's Agent in 2025
Violet Jaworska
Baird & Warner
(312) 282-7862
1 in this area
39 Total Sales
Source: Midwest Real Estate Data (MRED)
MLS Number: 12465882
APN: 09-20-418-017-0000
Disclaimer: Certain information contained herein is derived from information provided by parties other than Homes.com. All information provided is deemed reliable, but is not guaranteed to be accurate and should be independently verified.
![]() Based on information submitted to the MLS GRID. All data is obtained from various sources and may not have been verified by broker or MLS GRID. Supplied Open House Information is subject to change without notice. All information should be independently reviewed and verified for accuracy. Properties may or may not be listed by the office/agent presenting the information. Some IDX listings have been excluded from this website.
Based on information submitted to the MLS GRID. All data is obtained from various sources and may not have been verified by broker or MLS GRID. Supplied Open House Information is subject to change without notice. All information should be independently reviewed and verified for accuracy. Properties may or may not be listed by the office/agent presenting the information. Some IDX listings have been excluded from this website.
Based on information submitted to the MLS GRID
Ask me questions while you tour the home.