Estimated Value: $125,000 - $162,000
2
Beds
1
Bath
884
Sq Ft
$161/Sq Ft
Est. Value
About This Home
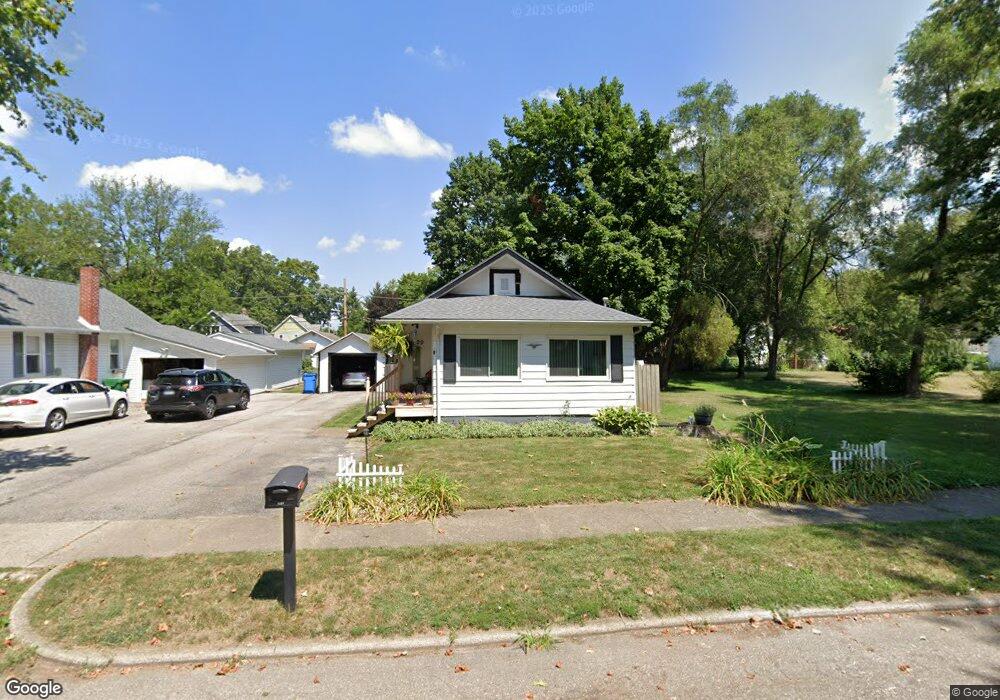
This home is located at 1529 Maple St, Niles, MI 49120 and is currently estimated at $142,161, approximately $160 per square foot. 1529 Maple St is a home located in Berrien County with nearby schools including James Ellis School, Howard-Ellis Elementary School, and Oak Manor Sixth Grade Center.
Ownership History
Date
Name
Owned For
Owner Type
Purchase Details
Closed on
Sep 25, 2023
Sold by
Davis Nancy K
Bought by
Davis Nancy K
Current Estimated Value
Home Financials for this Owner
Home Financials are based on the most recent Mortgage that was taken out on this home.
Original Mortgage
$25,000
Outstanding Balance
$24,350
Interest Rate
6.96%
Mortgage Type
Seller Take Back
Estimated Equity
$117,811
Purchase Details
Closed on
Sep 21, 2023
Sold by
Davis Nancy K
Bought by
Davis Nancy K and Johnson Shannon A
Home Financials for this Owner
Home Financials are based on the most recent Mortgage that was taken out on this home.
Original Mortgage
$25,000
Outstanding Balance
$24,350
Interest Rate
6.96%
Mortgage Type
Seller Take Back
Estimated Equity
$117,811
Purchase Details
Closed on
Dec 8, 1995
Purchase Details
Closed on
Jul 9, 1981
Purchase Details
Closed on
Mar 17, 1978
Purchase Details
Closed on
Oct 1, 1975
Create a Home Valuation Report for This Property
The Home Valuation Report is an in-depth analysis detailing your home's value as well as a comparison with similar homes in the area
Home Values in the Area
Average Home Value in this Area
Purchase History
| Date | Buyer | Sale Price | Title Company |
|---|---|---|---|
| Davis Nancy K | -- | None Listed On Document | |
| Davis Nancy K | -- | None Listed On Document | |
| -- | $100 | -- | |
| -- | $26,000 | -- | |
| -- | $18,500 | -- | |
| -- | $7,500 | -- |
Source: Public Records
Mortgage History
| Date | Status | Borrower | Loan Amount |
|---|---|---|---|
| Open | Davis Nancy K | $25,000 | |
| Closed | Davis Nancy K | $25,000 |
Source: Public Records
Tax History
| Year | Tax Paid | Tax Assessment Tax Assessment Total Assessment is a certain percentage of the fair market value that is determined by local assessors to be the total taxable value of land and additions on the property. | Land | Improvement |
|---|---|---|---|---|
| 2025 | $1,034 | $62,500 | $0 | $0 |
| 2024 | $802 | $57,800 | $0 | $0 |
| 2023 | $769 | $50,300 | $0 | $0 |
| 2022 | $732 | $46,900 | $0 | $0 |
| 2021 | $905 | $43,700 | $3,100 | $40,600 |
| 2020 | $895 | $34,400 | $0 | $0 |
| 2019 | $884 | $39,000 | $8,500 | $30,500 |
| 2018 | $855 | $39,000 | $0 | $0 |
| 2017 | $841 | $34,500 | $0 | $0 |
| 2016 | $823 | $26,900 | $0 | $0 |
| 2015 | $821 | $24,500 | $0 | $0 |
| 2014 | $636 | $24,400 | $0 | $0 |
Source: Public Records
Map
Nearby Homes
- 324 S 15th St
- 413 S 15th St
- 1451 Cedar St
- 1638 Superior St
- 1515 Inner Dr
- 1648 Oak St
- 0 S 15th St
- V/L S 15th St
- 1408 Silverbrook Ave
- 1008 Oak St
- 17 S 10th St
- 920 Cherry St
- 2112 Kathryn Dr
- 1314 Ferry St
- 2451 Spansail Dr
- V/L Kathryn St Unit Tract 3
- 724 Hickory St
- 607 N 18th St
- 1316 Eagle St
- 0 Kathryn St Unit Tract 1
Your Personal Tour Guide
Ask me questions while you tour the home.