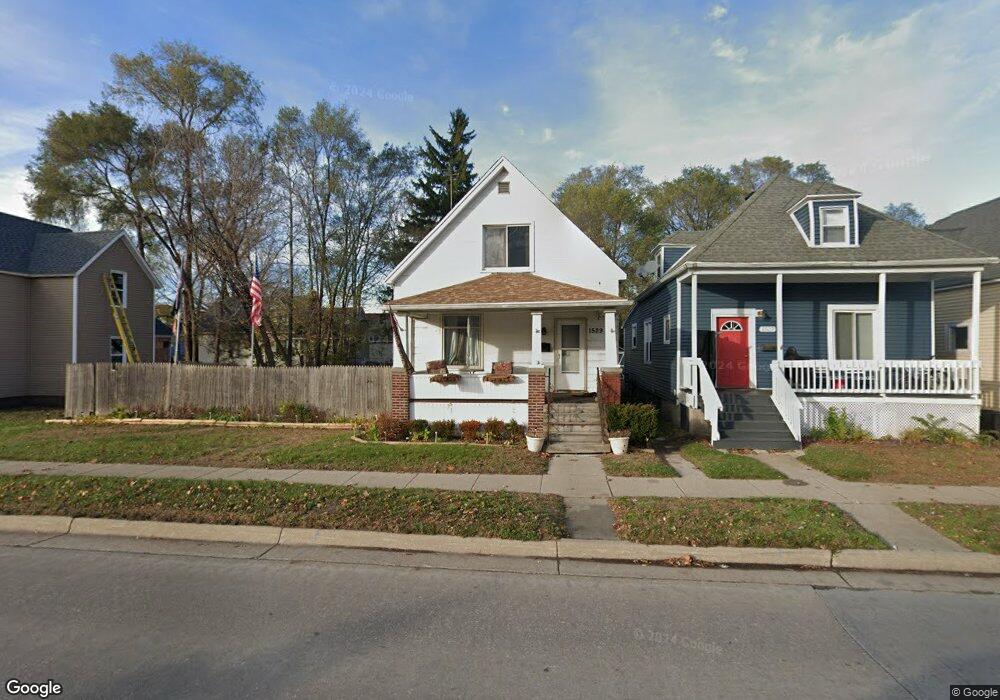
1529 Oak St Port Huron, MI 48060
Estimated Value: $88,000
3
Beds
1
Bath
1,126
Sq Ft
$78/Sq Ft
Est. Value
About This Home
This home is located at 1529 Oak St, Port Huron, MI 48060 and is currently priced at $88,000, approximately $78 per square foot. 1529 Oak St is a home located in St. Clair County with nearby schools including Woodrow Wilson Elementary School, Central Middle School, and Port Huron High School.
Ownership History
Date
Name
Owned For
Owner Type
Purchase Details
Closed on
Jan 9, 2018
Sold by
Kohl Andrew J and Kohl Melissa M
Bought by
Devroy Joshua and Ward Cassie
Current Estimated Value
Purchase Details
Closed on
Aug 15, 2014
Sold by
Kohl Andrew J and Kohl Melissa M
Bought by
Devroy Joshua and Ward Cassie
Purchase Details
Closed on
Dec 7, 2011
Sold by
Secretary Of Housing & Urban Development
Bought by
Kohl Andrew J and Kohl Melissa M
Purchase Details
Closed on
May 2, 2011
Sold by
Nationwide Advantage Mortgage Company
Bought by
Secretary Of Housing & Urban Development
Purchase Details
Closed on
Jan 27, 2011
Sold by
Ninness Catherine A
Bought by
Nationwide Advantage Mortgage Company
Create a Home Valuation Report for This Property
The Home Valuation Report is an in-depth analysis detailing your home's value as well as a comparison with similar homes in the area
Home Values in the Area
Average Home Value in this Area
Purchase History
| Date | Buyer | Sale Price | Title Company |
|---|---|---|---|
| Devroy Joshua | $40,000 | -- | |
| Devroy Joshua | -- | None Available | |
| Kohl Andrew J | $10,000 | None Available | |
| Secretary Of Housing & Urban Development | -- | None Available | |
| Nationwide Advantage Mortgage Company | $48,533 | None Available |
Source: Public Records
Tax History Compared to Growth
Tax History
| Year | Tax Paid | Tax Assessment Tax Assessment Total Assessment is a certain percentage of the fair market value that is determined by local assessors to be the total taxable value of land and additions on the property. | Land | Improvement |
|---|---|---|---|---|
| 2023 | $872 | $0 | $0 | $0 |
| 2022 | $872 | $33,800 | $0 | $0 |
| 2021 | $828 | $28,800 | $0 | $0 |
| 2020 | $837 | $25,400 | $25,400 | $0 |
| 2019 | $745 | $18,000 | $0 | $0 |
| 2018 | $805 | $18,000 | $0 | $0 |
| 2017 | $720 | $16,900 | $0 | $0 |
| 2016 | $604 | $16,900 | $0 | $0 |
| 2015 | $862 | $16,800 | $16,800 | $0 |
| 2014 | $862 | $16,000 | $16,000 | $0 |
| 2013 | -- | $17,600 | $0 | $0 |
Source: Public Records
Map
Nearby Homes