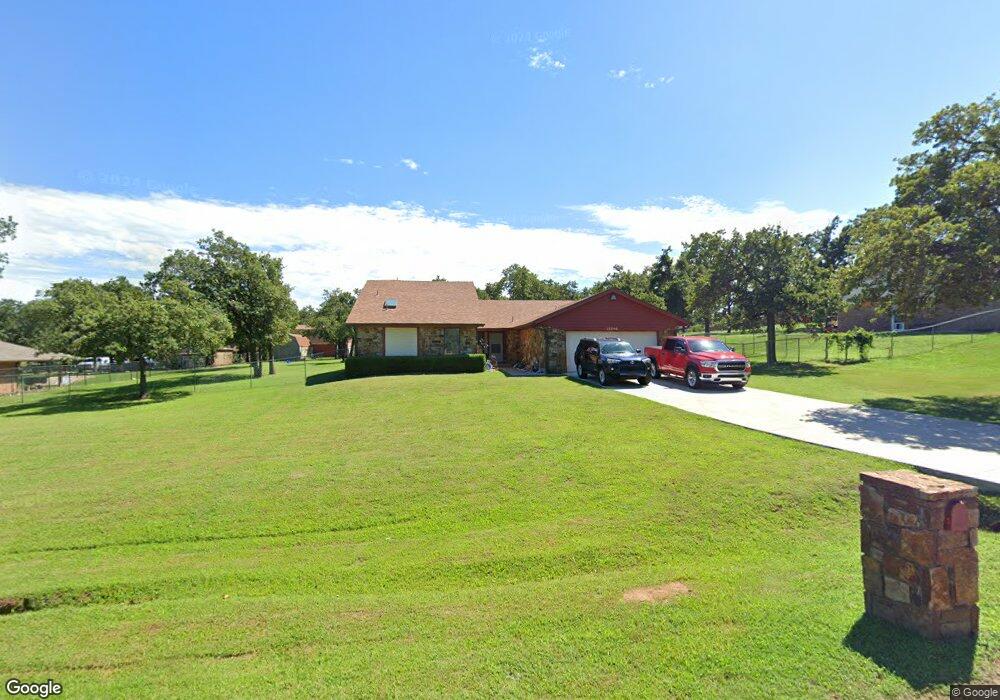
15296 Pheasant Run Choctaw, OK 73020
Estimated Value: $310,000 - $369,000
3
Beds
2
Baths
2,604
Sq Ft
$132/Sq Ft
Est. Value
About This Home
This home is located at 15296 Pheasant Run, Choctaw, OK 73020 and is currently estimated at $343,329, approximately $131 per square foot. 15296 Pheasant Run is a home located in Oklahoma County with nearby schools including Indian Meridian Elementary School, James Griffith Intermediate Elementary School, and Choctaw Middle School.
Ownership History
Date
Name
Owned For
Owner Type
Purchase Details
Closed on
Mar 14, 2006
Sold by
Pritchard Anthony E and Pritchard Shelba S
Bought by
Pritchard Anthony E and Pritchard Shelba S
Current Estimated Value
Home Financials for this Owner
Home Financials are based on the most recent Mortgage that was taken out on this home.
Original Mortgage
$179,730
Outstanding Balance
$101,876
Interest Rate
6.22%
Mortgage Type
Fannie Mae Freddie Mac
Estimated Equity
$241,453
Purchase Details
Closed on
Jul 12, 2000
Sold by
Sloan Gregory A and Sloan Sheila A
Bought by
Pritchard Anthony E
Home Financials for this Owner
Home Financials are based on the most recent Mortgage that was taken out on this home.
Original Mortgage
$126,450
Interest Rate
8.23%
Mortgage Type
VA
Purchase Details
Closed on
Feb 20, 1998
Sold by
Bolt Christopher D and Bolt Sharon D
Bought by
Sloan Gregory A and Sloan Sheila A
Create a Home Valuation Report for This Property
The Home Valuation Report is an in-depth analysis detailing your home's value as well as a comparison with similar homes in the area
Home Values in the Area
Average Home Value in this Area
Purchase History
| Date | Buyer | Sale Price | Title Company |
|---|---|---|---|
| Pritchard Anthony E | -- | None Available | |
| Pritchard Anthony E | $124,000 | Capitol Abstract & Title Co | |
| Sloan Gregory A | $114,000 | Stewart Escrow & Title |
Source: Public Records
Mortgage History
| Date | Status | Borrower | Loan Amount |
|---|---|---|---|
| Open | Pritchard Anthony E | $179,730 | |
| Closed | Pritchard Anthony E | $126,450 |
Source: Public Records
Tax History Compared to Growth
Tax History
| Year | Tax Paid | Tax Assessment Tax Assessment Total Assessment is a certain percentage of the fair market value that is determined by local assessors to be the total taxable value of land and additions on the property. | Land | Improvement |
|---|---|---|---|---|
| 2024 | $2,656 | $24,202 | $4,159 | $20,043 |
| 2023 | $2,656 | $23,498 | $3,128 | $20,370 |
| 2022 | $2,533 | $22,814 | $3,510 | $19,304 |
| 2021 | $2,457 | $22,150 | $3,679 | $18,471 |
| 2020 | $2,395 | $21,505 | $4,019 | $17,486 |
| 2019 | $2,673 | $22,863 | $2,975 | $19,888 |
| 2018 | $2,553 | $21,775 | $0 | $0 |
| 2017 | $2,426 | $20,737 | $2,813 | $17,924 |
| 2016 | $2,324 | $19,749 | $2,762 | $16,987 |
| 2015 | $2,216 | $18,809 | $3,244 | $15,565 |
| 2014 | $2,281 | $19,164 | $3,218 | $15,946 |
Source: Public Records
Map
Nearby Homes
- 0 Morningside Dr
- 0 SE 15th St
- 15819 SE 15th St
- 1668 E Circle Dr
- 571 Misty Morning Dr
- 14404 Ironside Dr
- 16334 E Reno Ave
- 1371 Whippoorwill Nest
- 16406 Sandstone Cir
- 16441 Roserock Cir
- 14248 MacKlay Ct
- 900 N Choctaw Rd
- 16523 Roserock Cir
- 14356 NE 4th St
- 0 000 Unit 1139707
- 00000 Henney Rd
- 0 Henney Rd
- 1625 Shaylee Ln
- 16651 Roserock Cir
- 0 NE Rd Unit 1145972
- 15324 Pheasant Run
- 15323 Pheasant Run
- 15297 Pheasant Run
- 15263 Pheasant Run
- 15356 Pheasant Run
- 15236 Pheasant Run
- 15355 Pheasant Run
- 15295 Falcon Way
- 15225 Pheasant Run
- 15267 Falcon Way
- 15323 Falcon Way
- 15198 Pheasant Run
- 15386 Pheasant Run
- 15355 Falcon Way
- 15225 Falcon Way
- 15197 Pheasant Run
- 15385 Pheasant Run
- 15197 Falcon Way
- 15170 Pheasant Run
- 15385 Falcon Way