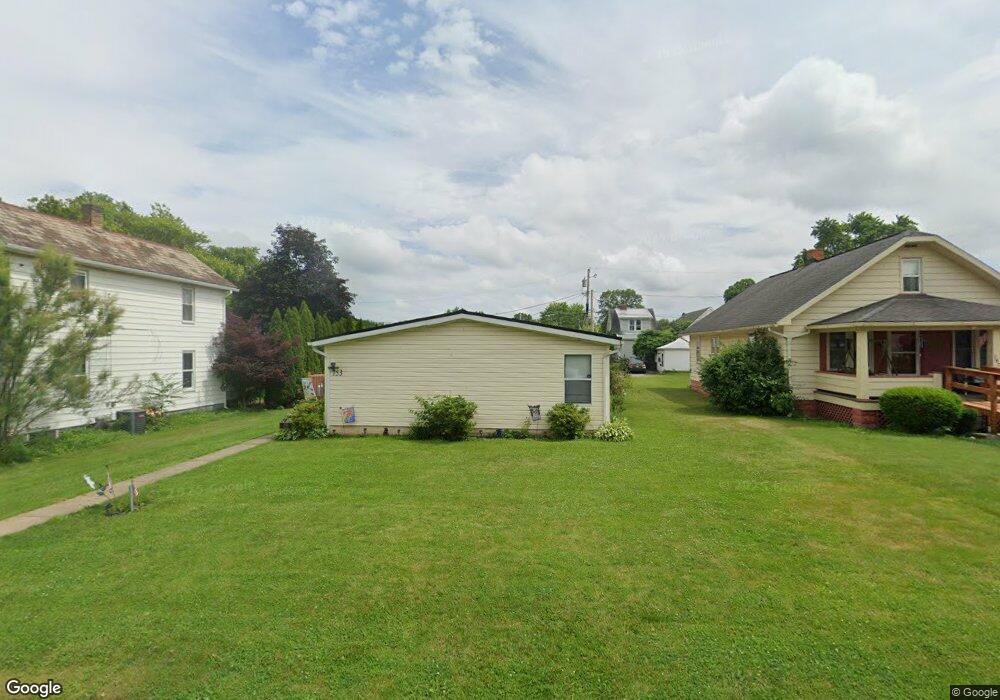
153 11th St NE New Philadelphia, OH 44663
Estimated Value: $167,000 - $221,000
3
Beds
2
Baths
1,560
Sq Ft
$123/Sq Ft
Est. Value
About This Home
This home is located at 153 11th St NE, New Philadelphia, OH 44663 and is currently estimated at $192,185, approximately $123 per square foot. 153 11th St NE is a home located in Tuscarawas County with nearby schools including New Philadelphia High School, Quaker Preparatory Academy, and Quaker Digital Academy.
Ownership History
Date
Name
Owned For
Owner Type
Purchase Details
Closed on
Sep 27, 2007
Sold by
Scandolari Ferdinand and Kleyman James L
Bought by
Kleyman James L and Kleyman Jo A
Current Estimated Value
Purchase Details
Closed on
Aug 8, 2003
Sold by
Scandolari Ferdinand A and Scandolari Nora M
Bought by
Scandolari Ferdinand A and Kleyman Jo A
Purchase Details
Closed on
Jul 2, 2003
Sold by
Scandolari Nora M
Bought by
Scandolari Ferdinand A
Purchase Details
Closed on
Apr 12, 1990
Sold by
Scandolari Ferdinand A and Scandolari Nora
Bought by
Scandolari Ferdinand A and Scandolari Nora
Purchase Details
Closed on
Apr 11, 1989
Bought by
Kleyman James L and Kleyman Jo A
Purchase Details
Closed on
Mar 17, 1989
Sold by
Gibbs Erma E
Bought by
Valentine-Beule Realty Inc and Kleyman Jo A
Create a Home Valuation Report for This Property
The Home Valuation Report is an in-depth analysis detailing your home's value as well as a comparison with similar homes in the area
Home Values in the Area
Average Home Value in this Area
Purchase History
| Date | Buyer | Sale Price | Title Company |
|---|---|---|---|
| Kleyman James L | -- | None Available | |
| Scandolari Ferdinand A | -- | -- | |
| Scandolari Ferdinand A | -- | -- | |
| Scandolari Ferdinand A | -- | -- | |
| Kleyman James L | $12,000 | -- | |
| Valentine-Beule Realty Inc | $8,000 | -- |
Source: Public Records
Tax History Compared to Growth
Tax History
| Year | Tax Paid | Tax Assessment Tax Assessment Total Assessment is a certain percentage of the fair market value that is determined by local assessors to be the total taxable value of land and additions on the property. | Land | Improvement |
|---|---|---|---|---|
| 2024 | $1,811 | $47,050 | $7,250 | $39,800 |
| 2023 | $1,811 | $134,410 | $20,700 | $113,710 |
| 2022 | $1,824 | $47,044 | $7,245 | $39,799 |
| 2021 | $1,523 | $36,929 | $5,068 | $31,861 |
| 2020 | $1,530 | $36,929 | $5,068 | $31,861 |
| 2019 | $1,529 | $36,929 | $5,068 | $31,861 |
| 2018 | $1,412 | $32,260 | $4,430 | $27,830 |
| 2017 | $1,389 | $32,260 | $4,430 | $27,830 |
| 2016 | $1,491 | $32,260 | $4,430 | $27,830 |
| 2014 | $1,318 | $29,010 | $4,030 | $24,980 |
| 2013 | $1,089 | $29,010 | $4,030 | $24,980 |
Source: Public Records
Map
Nearby Homes
- 221 Sea Gull Dr SE
- 247 Kent Cir NE
- 377 Schoenbrunn Dr NE
- 231 4th St SE
- 429 Beitler Ave NE
- 451 Mill Ave SE
- 1451 Ridge Rd NE
- 240 3rd St NE
- 1577 State Route 39 NE
- 416 2nd Dr NE
- 132 North Ave NE
- 427 Sycamore Cir SE
- 217 Minnich Ave NE
- 241 Saint Clair Ave SW
- 348 N Broadway St
- 1149 Jefferson St SE
- 206 Watson Cir NE
- 405 Front Ave SW
- 360 3rd St NW
- 2163 E High Ave
- 157 11th St NE
- 147 11th St NE
- 141 11th St NE
- 148 12th St NE
- 135 11th St NE
- 136 12th St NE
- 154 11th St NE
- 146 11th St NE
- 140 12th St NE Unit A
- 132 12th St NE
- 133 11th St NE
- 142 11th St NE
- 136 11th St NE
- 1101 Ray Ave NE
- 1121 Ray Ave NE
- 124 12th St NE
- 1031 Ray Ave NE
- 1031 Ray Ave NE Unit EXT
- 132 11th St NE
- 123 11th St NE