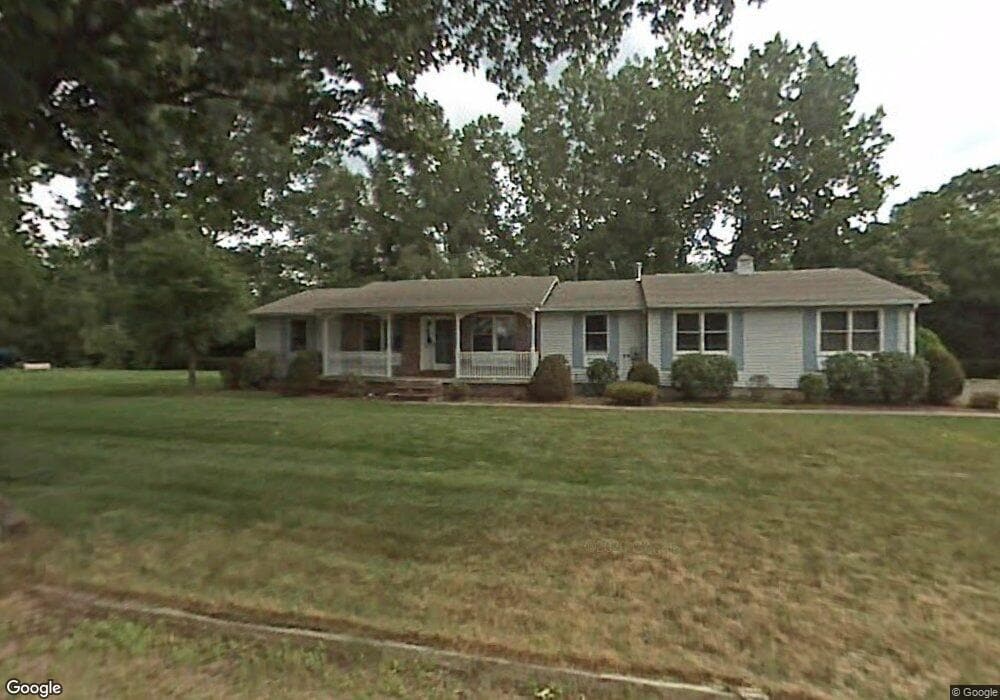
153 Anthony St Agawam, MA 01001
Estimated Value: $392,000 - $503,000
3
Beds
2
Baths
1,352
Sq Ft
$311/Sq Ft
Est. Value
About This Home
This home is located at 153 Anthony St, Agawam, MA 01001 and is currently estimated at $420,980, approximately $311 per square foot. 153 Anthony St is a home located in Hampden County with nearby schools including Agawam Junior High School, Agawam High School, and St Thomas The Apostle School.
Ownership History
Date
Name
Owned For
Owner Type
Purchase Details
Closed on
Apr 30, 2008
Sold by
Foley Patrick J
Bought by
Eitel Jane E and Eitel Jason E
Current Estimated Value
Home Financials for this Owner
Home Financials are based on the most recent Mortgage that was taken out on this home.
Original Mortgage
$116,000
Outstanding Balance
$73,884
Interest Rate
5.99%
Mortgage Type
Purchase Money Mortgage
Estimated Equity
$347,096
Purchase Details
Closed on
Jul 25, 2002
Sold by
James Robert T and Little Kimberly L
Bought by
Foley Patrick J
Home Financials for this Owner
Home Financials are based on the most recent Mortgage that was taken out on this home.
Original Mortgage
$133,000
Interest Rate
6.73%
Mortgage Type
Purchase Money Mortgage
Purchase Details
Closed on
Jul 29, 1994
Sold by
Rosati Thomas J
Bought by
James Robert T and Little Kimberly L
Home Financials for this Owner
Home Financials are based on the most recent Mortgage that was taken out on this home.
Original Mortgage
$134,900
Interest Rate
8.25%
Mortgage Type
Purchase Money Mortgage
Create a Home Valuation Report for This Property
The Home Valuation Report is an in-depth analysis detailing your home's value as well as a comparison with similar homes in the area
Home Values in the Area
Average Home Value in this Area
Purchase History
| Date | Buyer | Sale Price | Title Company |
|---|---|---|---|
| Eitel Jane E | $246,000 | -- | |
| Foley Patrick J | $189,953 | -- | |
| James Robert T | $142,000 | -- |
Source: Public Records
Mortgage History
| Date | Status | Borrower | Loan Amount |
|---|---|---|---|
| Open | Eitel Jane E | $116,000 | |
| Previous Owner | Foley Patrick J | $133,000 | |
| Previous Owner | James Robert T | $134,900 |
Source: Public Records
Tax History Compared to Growth
Tax History
| Year | Tax Paid | Tax Assessment Tax Assessment Total Assessment is a certain percentage of the fair market value that is determined by local assessors to be the total taxable value of land and additions on the property. | Land | Improvement |
|---|---|---|---|---|
| 2025 | $5,060 | $345,600 | $112,000 | $233,600 |
| 2024 | $4,910 | $337,700 | $112,000 | $225,700 |
| 2023 | $4,743 | $300,600 | $97,100 | $203,500 |
| 2022 | $4,532 | $281,300 | $97,100 | $184,200 |
| 2021 | $4,434 | $263,900 | $84,000 | $179,900 |
| 2020 | $4,367 | $259,500 | $82,800 | $176,700 |
| 2019 | $4,262 | $256,000 | $81,100 | $174,900 |
| 2018 | $4,059 | $244,400 | $81,100 | $163,300 |
| 2017 | $3,879 | $237,800 | $81,100 | $156,700 |
| 2016 | $3,799 | $234,800 | $81,100 | $153,700 |
| 2015 | $3,649 | $231,800 | $81,100 | $150,700 |
Source: Public Records
Map
Nearby Homes
- 0 Silver St
- 4H Mapleviewlane Unit 4H
- 6 Mansion Woods Dr Unit A
- 869-871 Main St
- 1 Castle Hill Rd Unit D
- 4 H Castle Hills Rd Unit H
- 14 Greenacre Ln
- 83 Fairview St
- 354 Rowley St
- 73 Silver Lake Dr
- 25 Castle Hill Rd Unit E
- 969 Main St
- 420 Main St Unit 82
- 420 Main St Unit 71
- 42 Lakeview Cir
- 11 Stanley Place
- 712 Cooper St
- 49 Hearthstone Dr
- 121 Reed St
- 135 Corey Colonial
- 135 Valentine St
- 141 Anthony St
- 3 Valentine Terrace
- 134 Anthony St
- 138 Valentine St
- 127 Valentine St
- 0 Opportunity Way Unit 70733853
- Lot 7 Stevenson Ln
- 295 Essex Dr Unit 295
- 291 Essex Dr Unit 291
- 290 Essex Dr Unit 290
- 294 Essex Dr Unit 294
- 131 Anthony St
- 130 Valentine St
- 11 Valentine Terrace
- 124 Anthony St
- 119 Valentine St
- 18 Valentine St
- 122 Valentine St
- 123 Anthony St