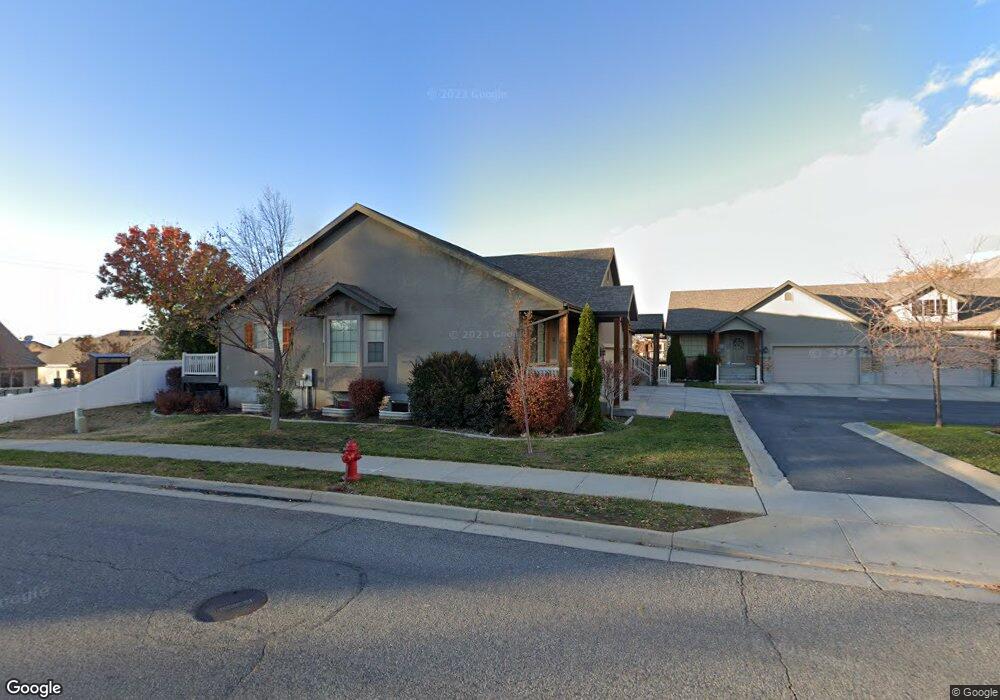
153 Bamberger Way Centerville, UT 84014
Estimated Value: $536,000 - $593,000
3
Beds
3
Baths
2,595
Sq Ft
$218/Sq Ft
Est. Value
About This Home
This home is located at 153 Bamberger Way, Centerville, UT 84014 and is currently estimated at $566,489, approximately $218 per square foot. 153 Bamberger Way is a home located in Davis County with nearby schools including J A Taylor Elementary School, Centerville Jr High, and Viewmont High School.
Ownership History
Date
Name
Owned For
Owner Type
Purchase Details
Closed on
Mar 20, 2023
Sold by
Thomson Family Trust
Bought by
Riley Dennis M and Riley Mary Lee
Current Estimated Value
Purchase Details
Closed on
Jun 14, 2022
Sold by
Alison Thomson
Bought by
Thomson Family Trust
Purchase Details
Closed on
Mar 30, 2020
Sold by
Smith Kathleen
Bought by
Thomson Alison
Purchase Details
Closed on
Jul 17, 2013
Sold by
Bluestone Capital Llc
Bought by
Smith Kathleen
Purchase Details
Closed on
Nov 13, 2008
Sold by
Walton Lane Llc
Bought by
Bluestone Capital Llc
Create a Home Valuation Report for This Property
The Home Valuation Report is an in-depth analysis detailing your home's value as well as a comparison with similar homes in the area
Home Values in the Area
Average Home Value in this Area
Purchase History
| Date | Buyer | Sale Price | Title Company |
|---|---|---|---|
| Riley Dennis M | -- | -- | |
| Thomson Family Trust | -- | None Listed On Document | |
| Thomson Alison | -- | None Available | |
| Smith Kathleen | -- | Aspen Title Insuranc | |
| Bluestone Capital Llc | -- | Accommodation |
Source: Public Records
Tax History Compared to Growth
Tax History
| Year | Tax Paid | Tax Assessment Tax Assessment Total Assessment is a certain percentage of the fair market value that is determined by local assessors to be the total taxable value of land and additions on the property. | Land | Improvement |
|---|---|---|---|---|
| 2025 | $3,145 | $300,850 | $72,050 | $228,800 |
| 2024 | $3,177 | $309,100 | $55,000 | $254,100 |
| 2023 | $3,220 | $566,000 | $98,000 | $468,000 |
| 2022 | $3,318 | $321,200 | $52,800 | $268,400 |
| 2021 | $2,740 | $413,100 | $69,000 | $344,100 |
| 2020 | $2,501 | $377,000 | $64,500 | $312,500 |
| 2019 | $2,391 | $352,000 | $62,000 | $290,000 |
| 2018 | $2,248 | $327,000 | $58,000 | $269,000 |
| 2016 | $1,906 | $154,110 | $20,350 | $133,760 |
| 2015 | $1,894 | $144,430 | $20,350 | $124,080 |
| 2014 | $1,841 | $143,648 | $18,333 | $125,315 |
| 2013 | -- | $138,612 | $19,250 | $119,362 |
Source: Public Records
Map
Nearby Homes
- 157 Bamberger Way
- 147 Bamberger Way
- 143 Bamberger Way
- 131 Cara Vella Ln
- 127 Bamberger Way
- 145 Cara Vella Ln
- 123 Bamberger Way
- 205 S 160 W
- 225 S 160 W
- 126 Bamberger Way
- 93 Cara Vella Ln
- 101 Bamberger Way
- 105 Bamberger Way
- 122 Bamberger Way
- 245 S 160 W
- 97 Bamberger Way
- 158 Cara Vella Ln
- 75 Cara Vella Ln
- 224 Sienna Ln
- 231 Sienna Ln