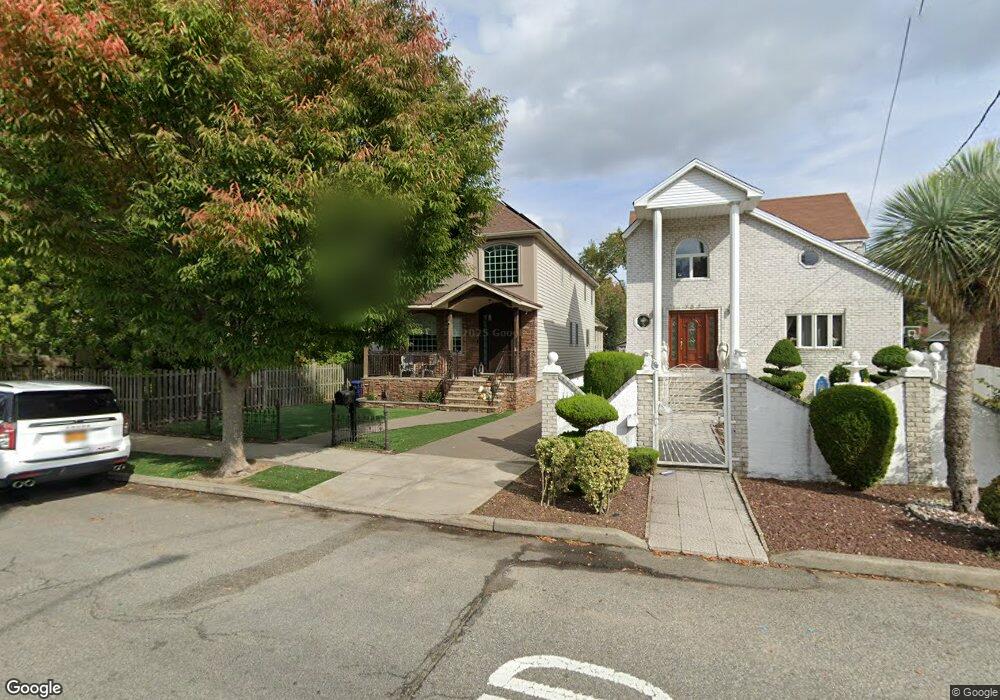
153 Bedell Ave Staten Island, NY 10307
Tottenville NeighborhoodEstimated Value: $1,055,825 - $1,329,000
--
Bed
4
Baths
2,452
Sq Ft
$491/Sq Ft
Est. Value
About This Home
This home is located at 153 Bedell Ave, Staten Island, NY 10307 and is currently estimated at $1,203,706, approximately $490 per square foot. 153 Bedell Ave is a home located in Richmond County with nearby schools including P.S. 6 Cpl Allan F Kivlehan School, Is 34 Tottenville, and Tottenville High School.
Ownership History
Date
Name
Owned For
Owner Type
Purchase Details
Closed on
May 16, 2018
Sold by
Stissi Peter
Bought by
Pepe Vincent and Romeo Christina
Current Estimated Value
Home Financials for this Owner
Home Financials are based on the most recent Mortgage that was taken out on this home.
Original Mortgage
$632,000
Outstanding Balance
$544,173
Interest Rate
4.4%
Mortgage Type
New Conventional
Estimated Equity
$659,533
Purchase Details
Closed on
Apr 2, 2004
Sold by
Meehan Donna Ann and Reese Jody James
Bought by
Stissi Peter
Home Financials for this Owner
Home Financials are based on the most recent Mortgage that was taken out on this home.
Original Mortgage
$198,300
Interest Rate
6.32%
Mortgage Type
Purchase Money Mortgage
Purchase Details
Closed on
Oct 23, 2001
Sold by
Reese Ann
Bought by
Reese Arthur Patrick and Meehan Donna Ann
Create a Home Valuation Report for This Property
The Home Valuation Report is an in-depth analysis detailing your home's value as well as a comparison with similar homes in the area
Home Values in the Area
Average Home Value in this Area
Purchase History
| Date | Buyer | Sale Price | Title Company |
|---|---|---|---|
| Pepe Vincent | $790,000 | Thompson Land Services Inc | |
| Stissi Peter | $247,909 | First American Title Insuran | |
| Reese Arthur Patrick | -- | -- |
Source: Public Records
Mortgage History
| Date | Status | Borrower | Loan Amount |
|---|---|---|---|
| Open | Pepe Vincent | $632,000 | |
| Previous Owner | Stissi Peter | $198,300 |
Source: Public Records
Tax History Compared to Growth
Tax History
| Year | Tax Paid | Tax Assessment Tax Assessment Total Assessment is a certain percentage of the fair market value that is determined by local assessors to be the total taxable value of land and additions on the property. | Land | Improvement |
|---|---|---|---|---|
| 2025 | $10,019 | $64,080 | $15,218 | $48,862 |
| 2024 | $10,031 | $58,800 | $15,646 | $43,154 |
| 2023 | $9,541 | $48,379 | $13,949 | $34,430 |
| 2022 | $9,354 | $57,720 | $17,940 | $39,780 |
| 2021 | $9,286 | $53,280 | $17,940 | $35,340 |
| 2020 | $9,292 | $52,620 | $17,940 | $34,680 |
| 2019 | $8,647 | $50,820 | $17,940 | $32,880 |
| 2018 | $7,921 | $40,316 | $16,789 | $23,527 |
| 2017 | $7,904 | $40,246 | $15,175 | $25,071 |
| 2016 | $7,281 | $37,969 | $14,226 | $23,743 |
| 2015 | $6,529 | $37,748 | $10,968 | $26,780 |
| 2014 | $6,529 | $35,612 | $12,147 | $23,465 |
Source: Public Records
Map
Nearby Homes