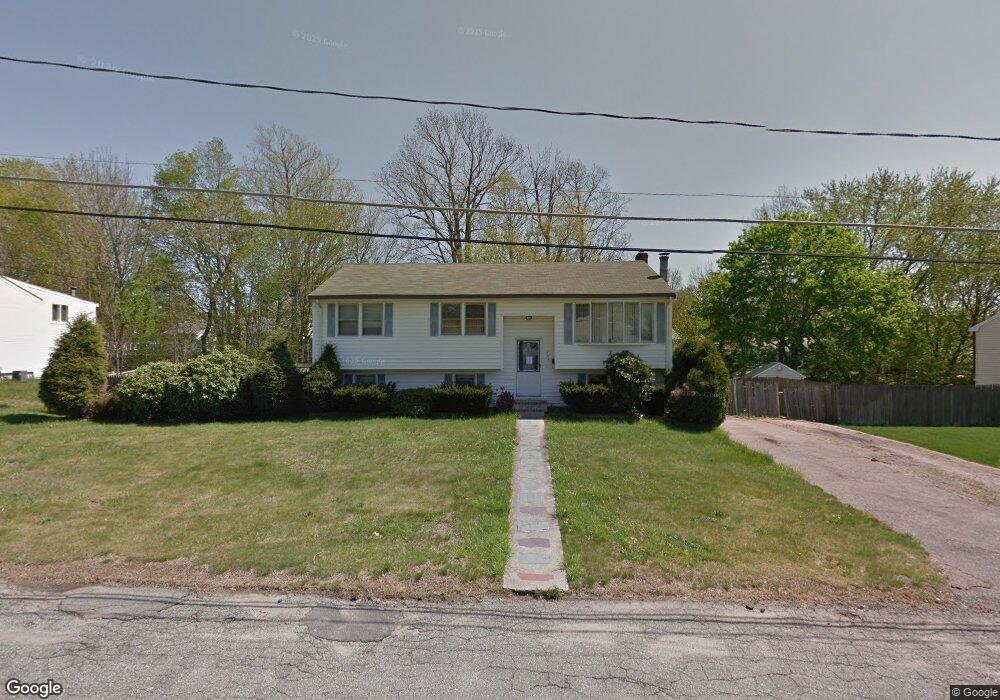
153 Bishop St Brockton, MA 02302
Estimated Value: $482,000 - $670,000
4
Beds
2
Baths
1,896
Sq Ft
$312/Sq Ft
Est. Value
About This Home
This home is located at 153 Bishop St, Brockton, MA 02302 and is currently estimated at $592,428, approximately $312 per square foot. 153 Bishop St is a home located in Plymouth County with nearby schools including Brookfield Elementary School, Downey Elementary School, and Ashfield Middle School.
Ownership History
Date
Name
Owned For
Owner Type
Purchase Details
Closed on
May 22, 2017
Sold by
Nauset Bay Llc
Bought by
Rodrigues Amaro and Rodrigues Ana
Current Estimated Value
Purchase Details
Closed on
Aug 12, 2016
Sold by
Duby Gail
Bought by
Nauset Bay Llc
Create a Home Valuation Report for This Property
The Home Valuation Report is an in-depth analysis detailing your home's value as well as a comparison with similar homes in the area
Home Values in the Area
Average Home Value in this Area
Purchase History
| Date | Buyer | Sale Price | Title Company |
|---|---|---|---|
| Rodrigues Amaro | $252,000 | -- | |
| Nauset Bay Llc | $70,000 | -- |
Source: Public Records
Tax History Compared to Growth
Tax History
| Year | Tax Paid | Tax Assessment Tax Assessment Total Assessment is a certain percentage of the fair market value that is determined by local assessors to be the total taxable value of land and additions on the property. | Land | Improvement |
|---|---|---|---|---|
| 2025 | $6,227 | $514,200 | $145,800 | $368,400 |
| 2024 | $6,097 | $507,200 | $145,800 | $361,400 |
| 2023 | $5,629 | $433,700 | $110,800 | $322,900 |
| 2022 | $5,184 | $371,100 | $100,800 | $270,300 |
| 2021 | $5,288 | $364,700 | $95,500 | $269,200 |
| 2020 | $4,668 | $308,100 | $91,500 | $216,600 |
| 2019 | $4,440 | $285,700 | $85,900 | $199,800 |
| 2018 | $4,331 | $269,700 | $85,900 | $183,800 |
| 2017 | $4,002 | $248,600 | $85,900 | $162,700 |
| 2016 | $3,970 | $228,700 | $81,900 | $146,800 |
| 2015 | $3,657 | $201,500 | $81,900 | $119,600 |
| 2014 | $3,526 | $194,500 | $81,900 | $112,600 |
Source: Public Records
Map
Nearby Homes