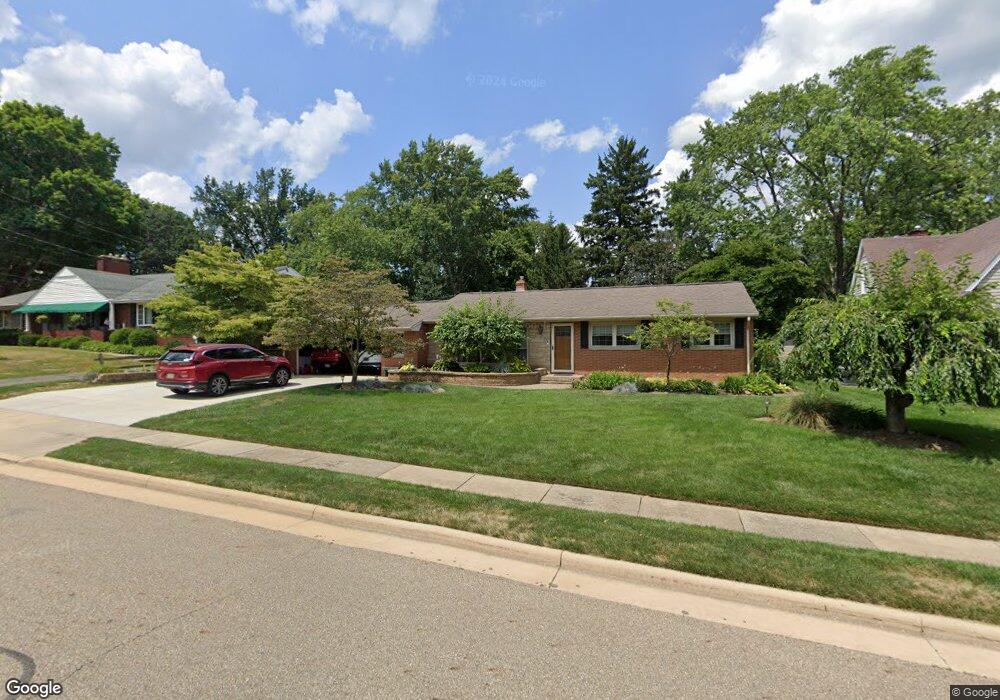
153 Bonnett St SW North Canton, OH 44720
Mount Vernon NeighborhoodEstimated Value: $234,000 - $247,000
3
Beds
2
Baths
1,260
Sq Ft
$191/Sq Ft
Est. Value
About This Home
This home is located at 153 Bonnett St SW, North Canton, OH 44720 and is currently estimated at $240,118, approximately $190 per square foot. 153 Bonnett St SW is a home located in Stark County with nearby schools including Orchard Hill Intermediate School, North Canton Middle School, and Hoover High School.
Ownership History
Date
Name
Owned For
Owner Type
Purchase Details
Closed on
Sep 26, 2023
Sold by
Collins Charles R and Collins Cheryl L
Bought by
Collins Preservation Trust and Collins
Current Estimated Value
Purchase Details
Closed on
Sep 11, 2017
Sold by
Collins Charles R and Collins Cheryl B
Bought by
Collins Charles R and Collins Cheryl B
Create a Home Valuation Report for This Property
The Home Valuation Report is an in-depth analysis detailing your home's value as well as a comparison with similar homes in the area
Home Values in the Area
Average Home Value in this Area
Purchase History
| Date | Buyer | Sale Price | Title Company |
|---|---|---|---|
| Collins Preservation Trust | -- | None Listed On Document | |
| Collins Charles R | -- | None Available |
Source: Public Records
Tax History Compared to Growth
Tax History
| Year | Tax Paid | Tax Assessment Tax Assessment Total Assessment is a certain percentage of the fair market value that is determined by local assessors to be the total taxable value of land and additions on the property. | Land | Improvement |
|---|---|---|---|---|
| 2025 | -- | $79,590 | $24,710 | $54,880 |
| 2024 | -- | $79,590 | $24,710 | $54,880 |
| 2023 | $3,085 | $57,680 | $17,500 | $40,180 |
| 2022 | $1,821 | $57,680 | $17,500 | $40,180 |
| 2021 | $1,701 | $57,680 | $17,500 | $40,180 |
| 2020 | $2,760 | $49,990 | $15,230 | $34,760 |
| 2019 | $440 | $49,990 | $15,230 | $34,760 |
| 2018 | $2,671 | $49,990 | $15,230 | $34,760 |
| 2017 | $2,368 | $46,550 | $12,600 | $33,950 |
| 2016 | $2,377 | $46,550 | $12,600 | $33,950 |
| 2015 | $2,386 | $46,550 | $12,600 | $33,950 |
| 2014 | $549 | $46,420 | $12,570 | $33,850 |
| 2013 | $1,278 | $46,420 | $12,570 | $33,850 |
Source: Public Records
Map
Nearby Homes
- 218 Bonnett St SW
- 236 Rose Lane St SW
- 139 Maplecrest St SW
- 1381 Circle Hill Rd SE
- 326 Bachtel St SW
- 1321 Clinton Ave SE
- 500 Heatherwood St SW
- 1126 Overridge Ave SE
- 256 Everhard Rd SW
- 1118 Overridge Ave SE
- 701 Edgewood St SE
- 1603 S Main St Unit B
- 1293 Westview Cir SE
- 1034 Schneider St SE
- 1443 Wilkshire Cir SW
- 1138 Lindy Lane Ave SW
- 1055 Easthill St SE
- 1480 Northfield Ave SE
- 727 Lorena St SW
- 1653 Greenway Rd SE Unit 202
- 147 Bonnett St SW
- 201 Bonnett St SW
- 142 James St SW
- 133 Bonnett St SW
- 130 James St SW
- 122 James St SW
- 202 James St SW
- 156 Bonnett St SW
- 219 Bonnett St SW
- 144 Bonnett St SW
- 200 Bonnett St SW
- 214 James St SW
- 208 Bonnett St SW
- 127 Bonnett St SW
- 134 Bonnett St SW
- 212 Bonnett St SW
- 124 Bonnett St SW
- 161 Hallum St SW
- 167 Hallum St SW
- 155 Hallum St SW