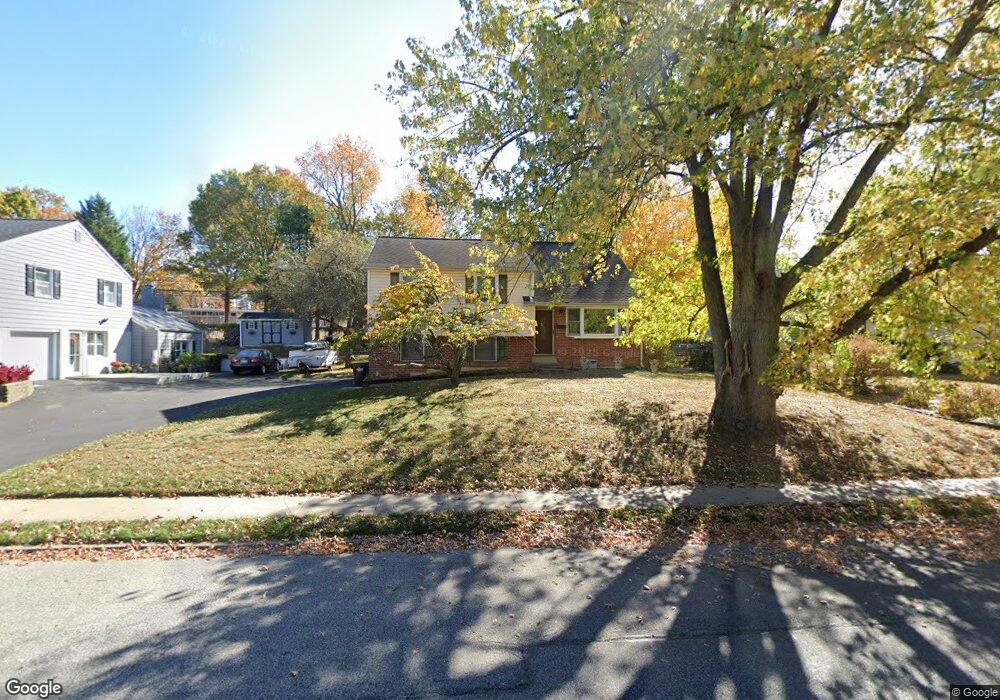
153 Cambridge Rd King of Prussia, PA 19406
Estimated Value: $471,491 - $527,000
4
Beds
2
Baths
1,890
Sq Ft
$263/Sq Ft
Est. Value
About This Home
This home is located at 153 Cambridge Rd, King of Prussia, PA 19406 and is currently estimated at $497,123, approximately $263 per square foot. 153 Cambridge Rd is a home located in Montgomery County with nearby schools including Caley Elementary School, Upper Merion Middle School, and Upper Merion High School.
Ownership History
Date
Name
Owned For
Owner Type
Purchase Details
Closed on
Jul 14, 2017
Sold by
Trimbath Mark W and Trimbath Laura M
Bought by
Trimbath Mark W and Trimbath Laura M
Current Estimated Value
Purchase Details
Closed on
Oct 29, 2009
Sold by
Dean Susan L
Bought by
Trimbath Mark W and Beaver Laura M
Home Financials for this Owner
Home Financials are based on the most recent Mortgage that was taken out on this home.
Original Mortgage
$263,636
Outstanding Balance
$170,907
Interest Rate
4.86%
Estimated Equity
$326,216
Purchase Details
Closed on
Dec 17, 2008
Sold by
Dean Susan L and Dean Michael
Bought by
Dean Susan L
Purchase Details
Closed on
Apr 18, 2000
Sold by
Dean Susan L
Bought by
Dean Michael and Dean Susan L
Purchase Details
Closed on
Jan 3, 1995
Sold by
Dean Michael and Dean Susan L
Bought by
Dean Susan L
Create a Home Valuation Report for This Property
The Home Valuation Report is an in-depth analysis detailing your home's value as well as a comparison with similar homes in the area
Home Values in the Area
Average Home Value in this Area
Purchase History
| Date | Buyer | Sale Price | Title Company |
|---|---|---|---|
| Trimbath Mark W | -- | None Available | |
| Trimbath Mark W | $268,500 | None Available | |
| Dean Susan L | -- | None Available | |
| Dean Michael | -- | -- | |
| Dean Susan L | -- | -- |
Source: Public Records
Mortgage History
| Date | Status | Borrower | Loan Amount |
|---|---|---|---|
| Open | Trimbath Mark W | $263,636 |
Source: Public Records
Tax History Compared to Growth
Tax History
| Year | Tax Paid | Tax Assessment Tax Assessment Total Assessment is a certain percentage of the fair market value that is determined by local assessors to be the total taxable value of land and additions on the property. | Land | Improvement |
|---|---|---|---|---|
| 2025 | $3,911 | $126,920 | $54,250 | $72,670 |
| 2024 | $3,911 | $126,920 | $54,250 | $72,670 |
| 2023 | $3,773 | $126,920 | $54,250 | $72,670 |
| 2022 | $3,611 | $126,920 | $54,250 | $72,670 |
| 2021 | $3,499 | $126,920 | $54,250 | $72,670 |
| 2020 | $3,344 | $126,920 | $54,250 | $72,670 |
| 2019 | $3,287 | $126,920 | $54,250 | $72,670 |
| 2018 | $3,286 | $126,920 | $54,250 | $72,670 |
| 2017 | $3,169 | $126,920 | $54,250 | $72,670 |
| 2016 | $3,119 | $126,920 | $54,250 | $72,670 |
| 2015 | $3,004 | $126,920 | $54,250 | $72,670 |
| 2014 | $3,004 | $126,920 | $54,250 | $72,670 |
Source: Public Records
Map
Nearby Homes
- 108 Anderson Rd
- 171 Redwood Rd
- 603 Nantucket Cir
- 243 Chapel Ln Unit 79A
- 251 Chapel Ln Unit 83B
- 410 Dorothy Dr
- 245 Chapel Ln Unit 80B
- 709 N Henderson Rd
- 732 Hidden Valley Rd
- 243 Jasper Rd
- 338 Ross Rd Unit C
- 699 Springdell Rd
- 604 Forge Springs Way
- 384 Aspen Way Unit 142
- 391 Prince Frederick St
- 374 Aspen Way Unit HS 139
- 418 Springhouse Rd
- 407 Chestnut Way
- 338 Rees Dr
- 361 Aspen Way
- 157 Cambridge Rd
- 145 Cambridge Rd
- 161 Cambridge Rd
- 152 Cambridge Rd
- 156 Cambridge Rd
- 146 Cambridge Rd
- 141 Cambridge Rd
- 165 Cambridge Rd
- 160 Cambridge Rd
- 142 Cambridge Rd
- 137 Cambridge Rd
- 169 Cambridge Rd
- 586 Dartmouth Dr
- 164 Cambridge Rd
- 138 Cambridge Rd
- 582 Dartmouth Dr
- 518 Dartmouth Dr
- 578 Dartmouth Dr
- 168 Cambridge Rd
- 133 Cambridge Rd