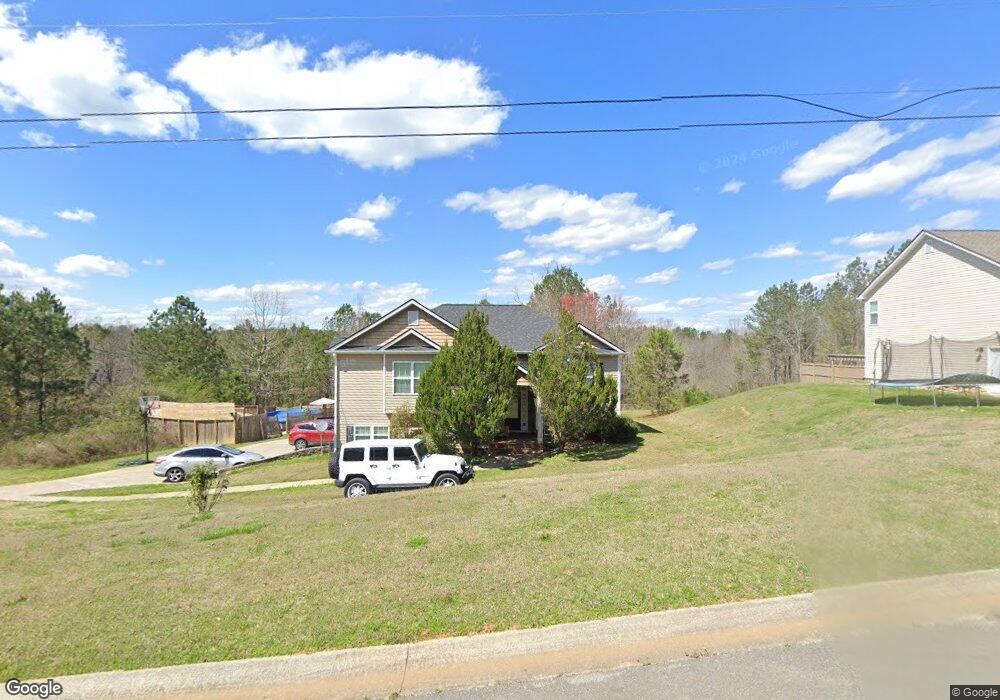
153 Cedar Creek Crossing Unit 11&12 Cedartown, GA 30125
Estimated Value: $310,000 - $374,000
4
Beds
3
Baths
2,765
Sq Ft
$126/Sq Ft
Est. Value
About This Home
This home is located at 153 Cedar Creek Crossing Unit 11&12, Cedartown, GA 30125 and is currently estimated at $348,943, approximately $126 per square foot. 153 Cedar Creek Crossing Unit 11&12 is a home located in Polk County with nearby schools including Vineyard Harvester Christian Academy and Cedar Christian School.
Ownership History
Date
Name
Owned For
Owner Type
Purchase Details
Closed on
Feb 5, 2014
Sold by
Karr Amelia C
Bought by
Kight Anita
Current Estimated Value
Home Financials for this Owner
Home Financials are based on the most recent Mortgage that was taken out on this home.
Original Mortgage
$123,979
Outstanding Balance
$94,301
Interest Rate
4.51%
Mortgage Type
New Conventional
Estimated Equity
$254,642
Purchase Details
Closed on
Sep 30, 2009
Sold by
South Paulding Properties Inc
Bought by
Karr Amelia C *
Home Financials for this Owner
Home Financials are based on the most recent Mortgage that was taken out on this home.
Original Mortgage
$164,286
Interest Rate
5.05%
Mortgage Type
New Conventional
Purchase Details
Closed on
Nov 26, 2008
Sold by
Not Provided
Bought by
Karr Amelia C
Purchase Details
Closed on
Nov 21, 2006
Sold by
Not Provided
Bought by
Karr Amelia C
Purchase Details
Closed on
Aug 1, 2006
Sold by
Not Provided
Bought by
Karr Amelia C
Create a Home Valuation Report for This Property
The Home Valuation Report is an in-depth analysis detailing your home's value as well as a comparison with similar homes in the area
Home Values in the Area
Average Home Value in this Area
Purchase History
| Date | Buyer | Sale Price | Title Company |
|---|---|---|---|
| Kight Anita | $121,500 | -- | |
| Karr Amelia C * | -- | -- | |
| Karr Amelia C | $156,750 | -- | |
| Karr Amelia C | $25,000 | -- | |
| Karr Amelia C | -- | -- |
Source: Public Records
Mortgage History
| Date | Status | Borrower | Loan Amount |
|---|---|---|---|
| Open | Kight Anita | $123,979 | |
| Previous Owner | Karr Amelia C * | $164,286 |
Source: Public Records
Tax History Compared to Growth
Tax History
| Year | Tax Paid | Tax Assessment Tax Assessment Total Assessment is a certain percentage of the fair market value that is determined by local assessors to be the total taxable value of land and additions on the property. | Land | Improvement |
|---|---|---|---|---|
| 2024 | $2,983 | $144,702 | $19,200 | $125,502 |
| 2023 | $2,451 | $105,278 | $19,200 | $86,078 |
| 2022 | $1,945 | $83,955 | $8,000 | $75,955 |
| 2021 | $1,970 | $83,955 | $8,000 | $75,955 |
| 2020 | $1,974 | $83,955 | $8,000 | $75,955 |
| 2019 | $2,004 | $76,620 | $10,000 | $66,620 |
| 2018 | $1,826 | $68,278 | $10,000 | $58,278 |
| 2017 | $1,804 | $68,278 | $10,000 | $58,278 |
| 2016 | $1,766 | $66,881 | $10,000 | $56,881 |
| 2015 | $1,139 | $67,075 | $10,000 | $57,075 |
| 2014 | $1,844 | $67,075 | $10,000 | $57,075 |
Source: Public Records
Map
Nearby Homes
- 383 Valley Grove Rd
- 100 Lee Ave
- 424 Michael Blvd
- 374 Seab Green Rd
- 0 Cave Spring Rd Unit 10631588
- 0 Cave Spring Rd Unit 7671027
- 1200 N Cave Spring St
- 600 Miller Rd
- 727 Cherokee Rd
- 39 Summerwind Dr
- 208 Silverthorn Way
- 217 Cherokee Cir
- LOT 21 Cherokee Cir
- 828 N College Dr
- 621 N College Dr
- 88 Sequoyah Ct
- 00 Oak Crest Dr
- 521 W John Hand Rd
- 113 Cherokee Estates Dr
- 112 College Cir
- 153 Cedar Creek Crossing
- 163 Cedar Creek Crossing
- 173 Cedar Creek Crossing
- 133 Cedar Creek Crossing
- 152 Cedar Creek Crossing
- 142 Cedar Creek Crossing
- 132 Cedar Creek Crossing
- 172 Cedar Creek Crossing
- 182 Cedar Creek Crossing
- 107 Cedar Creek Crossing
- 112 Cedar Creek Crossing
- 85 Cedar Creek Crossing
- 88 Cedar Creek Crossing
- 71 Cedar Creek Crossing
- 70 Cedar Creek Crossing
- 70 Cedar Creek Crossing Unit 24
- 49 Cedar Creek Crossing
- 1867 Cave Springs Rd
- 1786 Cave Springs Rd
- 1816 Cave Springs Rd