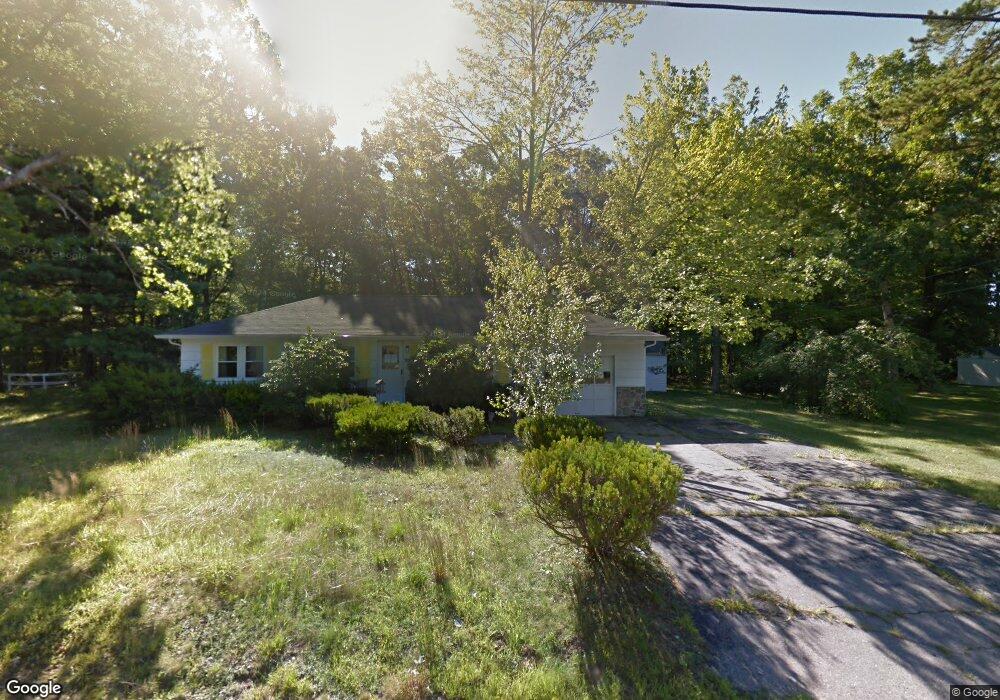
153 Farview Dr Sanford, ME 04073
South Sanford NeighborhoodEstimated Value: $342,580 - $395,000
3
Beds
1
Bath
960
Sq Ft
$386/Sq Ft
Est. Value
About This Home
This home is located at 153 Farview Dr, Sanford, ME 04073 and is currently estimated at $370,895, approximately $386 per square foot. 153 Farview Dr is a home located in York County with nearby schools including Sanford Christian Academy and St Thomas Consolidated School.
Ownership History
Date
Name
Owned For
Owner Type
Purchase Details
Closed on
Nov 29, 2011
Sold by
Department Of Housing & Urban Dev
Bought by
Dianni Michael J and Dianni Lori E
Current Estimated Value
Home Financials for this Owner
Home Financials are based on the most recent Mortgage that was taken out on this home.
Original Mortgage
$107,653
Outstanding Balance
$73,494
Interest Rate
4.12%
Mortgage Type
Unknown
Estimated Equity
$297,401
Create a Home Valuation Report for This Property
The Home Valuation Report is an in-depth analysis detailing your home's value as well as a comparison with similar homes in the area
Home Values in the Area
Average Home Value in this Area
Purchase History
| Date | Buyer | Sale Price | Title Company |
|---|---|---|---|
| Dianni Michael J | $100,000 | -- | |
| Dianni Michael J | $100,000 | -- |
Source: Public Records
Mortgage History
| Date | Status | Borrower | Loan Amount |
|---|---|---|---|
| Open | Dianni Michael J | $107,653 | |
| Closed | Dianni Michael J | $107,653 |
Source: Public Records
Tax History Compared to Growth
Tax History
| Year | Tax Paid | Tax Assessment Tax Assessment Total Assessment is a certain percentage of the fair market value that is determined by local assessors to be the total taxable value of land and additions on the property. | Land | Improvement |
|---|---|---|---|---|
| 2025 | $3,848 | $225,000 | $45,300 | $179,700 |
| 2024 | $3,632 | $225,000 | $45,300 | $179,700 |
| 2023 | $3,379 | $223,200 | $45,300 | $177,900 |
| 2022 | $3,303 | $223,200 | $45,300 | $177,900 |
| 2021 | $3,272 | $180,000 | $45,300 | $134,700 |
| 2020 | $3,216 | $159,500 | $45,300 | $114,200 |
| 2019 | $3,101 | $149,800 | $45,300 | $104,500 |
| 2018 | $2,983 | $145,500 | $45,300 | $100,200 |
| 2017 | $2,883 | $139,000 | $45,300 | $93,700 |
| 2016 | $2,940 | $129,300 | $45,300 | $84,000 |
| 2015 | $2,848 | $129,200 | $46,300 | $82,900 |
| 2014 | $2,793 | $129,200 | $46,300 | $82,900 |
| 2013 | -- | $129,200 | $46,300 | $82,900 |
Source: Public Records
Map
Nearby Homes
- 87 Farview Dr
- 13 Timothy Ln
- 6 Hewey St
- 8 Stoney Brook Rd
- 54 Malcolm Ave
- 102 Country Club 1 Rd Unit 15A
- 102 Country Club 1 Rd Unit 11B
- 5 Bedrock Dr Unit 5
- 7 Raymond St
- 1 Bedrock Dr Unit 1
- 2 Bedrock Dr Unit 2
- 8 Rock Pond Rd Unit 8
- 18 Oak Ridge Rd
- 7 Vermont St
- 27 Avon St
- 0 Pheasant Ln Unit 1633461
- 0 Pheasant Ln Unit 1611370
- 1013 Main St
- TBD Pheasant Ln
- 126 Jackson St