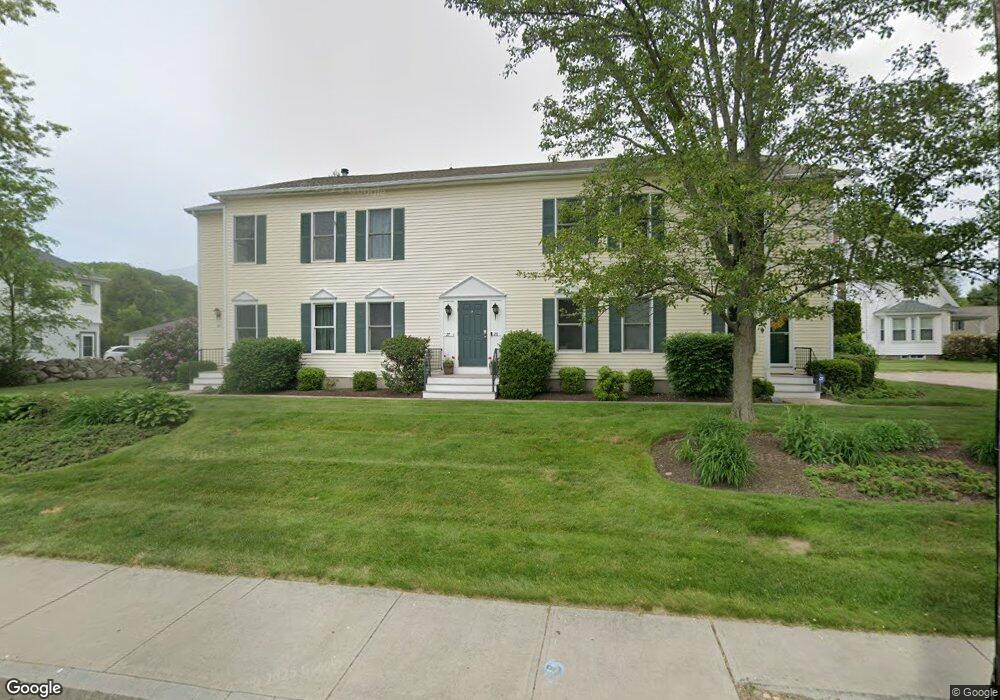
153 High St Unit 20 Westerly, RI 02891
Estimated Value: $382,000 - $411,000
2
Beds
2
Baths
1,300
Sq Ft
$303/Sq Ft
Est. Value
About This Home
This home is located at 153 High St Unit 20, Westerly, RI 02891 and is currently estimated at $393,972, approximately $303 per square foot. 153 High St Unit 20 is a home located in Washington County with nearby schools including Westerly High School and St. Michael School.
Ownership History
Date
Name
Owned For
Owner Type
Purchase Details
Closed on
Jun 7, 2022
Sold by
Laurenzo Albert J
Bought by
A J Laurenzo Irrevome T
Current Estimated Value
Purchase Details
Closed on
Jun 14, 2010
Sold by
Laurenzo Albert J
Bought by
Laurenzo Albert J and Laurenzo Elaine
Purchase Details
Closed on
Jun 15, 2006
Sold by
Ross Co Llc
Bought by
Laurenzo Albert J
Home Financials for this Owner
Home Financials are based on the most recent Mortgage that was taken out on this home.
Original Mortgage
$239,200
Interest Rate
6.62%
Mortgage Type
Purchase Money Mortgage
Purchase Details
Closed on
Jun 30, 1998
Sold by
Wicopesset Rock Assoc
Bought by
Rosso Kenneth B and Rosso Linda L
Home Financials for this Owner
Home Financials are based on the most recent Mortgage that was taken out on this home.
Original Mortgage
$67,000
Interest Rate
7.09%
Create a Home Valuation Report for This Property
The Home Valuation Report is an in-depth analysis detailing your home's value as well as a comparison with similar homes in the area
Home Values in the Area
Average Home Value in this Area
Purchase History
| Date | Buyer | Sale Price | Title Company |
|---|---|---|---|
| A J Laurenzo Irrevome T | -- | None Available | |
| Laurenzo Albert J | -- | None Available | |
| Laurenzo Albert J | -- | -- | |
| Laurenzo Albert J | $299,000 | -- | |
| Rosso Kenneth B | $96,000 | -- |
Source: Public Records
Mortgage History
| Date | Status | Borrower | Loan Amount |
|---|---|---|---|
| Previous Owner | Rosso Kenneth B | $212,814 | |
| Previous Owner | Rosso Kenneth B | $239,200 | |
| Previous Owner | Rosso Kenneth B | $67,000 |
Source: Public Records
Tax History Compared to Growth
Tax History
| Year | Tax Paid | Tax Assessment Tax Assessment Total Assessment is a certain percentage of the fair market value that is determined by local assessors to be the total taxable value of land and additions on the property. | Land | Improvement |
|---|---|---|---|---|
| 2025 | $2,635 | $338,700 | $0 | $338,700 |
| 2024 | $2,476 | $236,900 | $0 | $236,900 |
| 2023 | $2,407 | $236,900 | $0 | $236,900 |
| 2022 | $2,393 | $236,900 | $0 | $236,900 |
| 2021 | $2,758 | $228,700 | $0 | $228,700 |
| 2020 | $2,710 | $228,700 | $0 | $228,700 |
| 2019 | $2,685 | $228,700 | $0 | $228,700 |
| 2018 | $2,345 | $189,900 | $0 | $189,900 |
| 2017 | $2,279 | $189,900 | $0 | $189,900 |
| 2016 | $2,267 | $188,900 | $0 | $188,900 |
| 2015 | $1,998 | $177,900 | $0 | $177,900 |
| 2014 | $1,966 | $177,900 | $0 | $177,900 |
Source: Public Records
Map
Nearby Homes
- 153 High St Unit 3
- 153 High St Unit 21
- 153 High St Unit 22
- 153 High St Unit 18
- 153 High St Unit 25
- 153 High St Unit 30
- 153 High St Unit 10
- 153 High St Unit 23
- 153 High St Unit 15
- 153 High St Unit 1
- 153 High St Unit 7
- 153 High St Unit 17
- 153 High St Unit 4
- 153 High St Unit 19
- 153 High St Unit 9
- 153 High St Unit 16
- 153 High St Unit 8
- 153 High St Unit 6
- 153 High St Unit 5
- 153 High St Unit 35