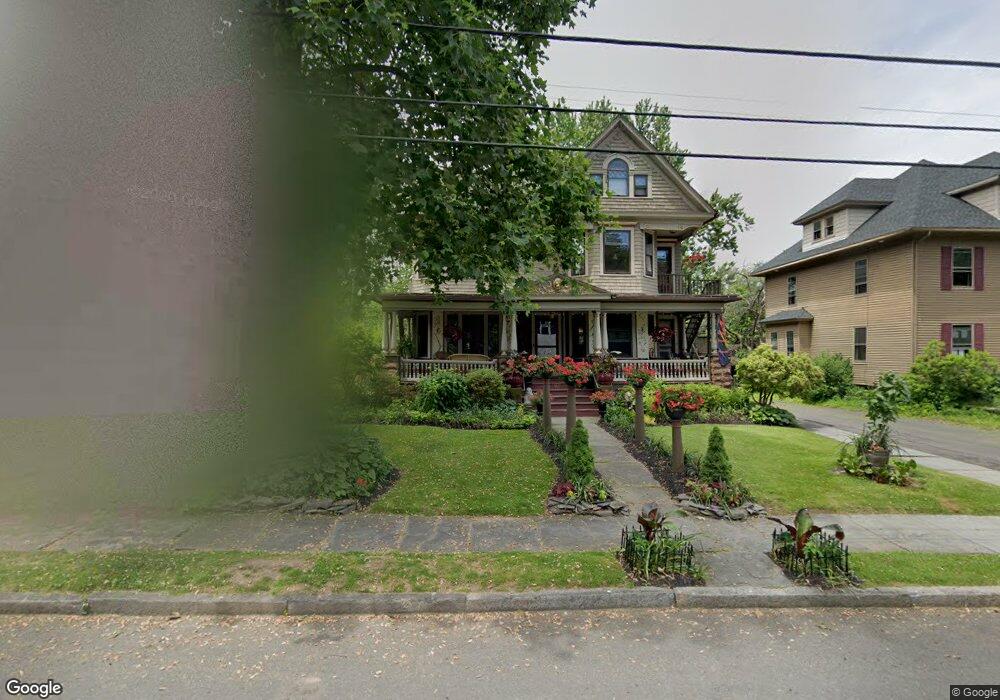
153 Kenyon St Unit 155 Hartford, CT 06105
West End NeighborhoodEstimated Value: $532,000 - $724,000
6
Beds
5
Baths
4,719
Sq Ft
$130/Sq Ft
Est. Value
About This Home
This home is located at 153 Kenyon St Unit 155, Hartford, CT 06105 and is currently estimated at $613,872, approximately $130 per square foot. 153 Kenyon St Unit 155 is a home located in Hartford County with nearby schools including Noah Webster Micro Society School, Rawson School, and McKinley School.
Ownership History
Date
Name
Owned For
Owner Type
Purchase Details
Closed on
Oct 31, 2016
Sold by
Kenyon Heights Associa
Bought by
La Maison De Lion Llc
Current Estimated Value
Home Financials for this Owner
Home Financials are based on the most recent Mortgage that was taken out on this home.
Original Mortgage
$10,000
Outstanding Balance
$8,027
Interest Rate
3.5%
Mortgage Type
Purchase Money Mortgage
Estimated Equity
$605,845
Purchase Details
Closed on
Jul 27, 2011
Sold by
Heary Marjorie H and Clark Jonathan E
Bought by
Kenyon Heights Assoc
Purchase Details
Closed on
Sep 9, 1998
Sold by
Henry Carl and Henry Marjorie
Bought by
Kenyon Heights Assoc
Create a Home Valuation Report for This Property
The Home Valuation Report is an in-depth analysis detailing your home's value as well as a comparison with similar homes in the area
Home Values in the Area
Average Home Value in this Area
Purchase History
| Date | Buyer | Sale Price | Title Company |
|---|---|---|---|
| La Maison De Lion Llc | $310,000 | -- | |
| Kenyon Heights Assoc | -- | -- | |
| Kenyon Heights Assoc | $130,000 | -- |
Source: Public Records
Mortgage History
| Date | Status | Borrower | Loan Amount |
|---|---|---|---|
| Open | Kenyon Heights Assoc | $10,000 | |
| Open | Kenyon Heights Assoc | $150,000 | |
| Closed | Kenyon Heights Assoc | $75,000 | |
| Previous Owner | Kenyon Heights Assoc | $157,000 |
Source: Public Records
Tax History Compared to Growth
Tax History
| Year | Tax Paid | Tax Assessment Tax Assessment Total Assessment is a certain percentage of the fair market value that is determined by local assessors to be the total taxable value of land and additions on the property. | Land | Improvement |
|---|---|---|---|---|
| 2025 | $11,040 | $160,120 | $40,094 | $120,026 |
| 2024 | $11,040 | $160,120 | $40,094 | $120,026 |
| 2023 | $11,040 | $160,120 | $40,094 | $120,026 |
| 2022 | $8,435 | $160,120 | $40,094 | $120,026 |
| 2021 | $8,435 | $113,540 | $38,185 | $75,355 |
| 2020 | $8,435 | $113,540 | $38,185 | $75,355 |
| 2019 | $8,435 | $113,540 | $38,185 | $75,355 |
| 2018 | $8,151 | $109,712 | $36,898 | $72,814 |
| 2016 | $8,409 | $113,186 | $35,141 | $78,045 |
| 2015 | $8,009 | $107,810 | $33,472 | $74,338 |
| 2014 | $7,813 | $105,174 | $32,654 | $72,520 |
Source: Public Records
Map
Nearby Homes
- 260 Oxford St Unit 262
- 276 Oxford St Unit 278
- 120 Whitney St
- 275 Kenyon St
- 62 Whitney St
- 28 Whitney St
- 94 Goodwin Cir Unit 94
- 31 Woodland St Unit 9 A
- 31 Woodland St Unit 4I
- 31 Woodland St Unit 1E
- 31 Woodland St Unit 7 O
- 31 Woodland St Unit 4G
- 30 Woodland St Unit 4G
- 30 Woodland St Unit 3D
- 30 Woodland St Unit 9H
- 30 Woodland St Unit 5H
- 40 Owen St Unit B5
- 40 Owen St Unit A3
- 14 Gray St Unit 16
- 11 Marshall St
- 143 Kenyon St
- 149 Kenyon St
- 139 Kenyon St
- 150 Kenyon St
- 148 Kenyon St
- 146 Kenyon St
- 137 Kenyon St
- 142 Kenyon St
- 157 Kenyon St
- 154 Kenyon St
- 171 Kenyon St Unit 173
- 158-160 Whitney St
- 164 Whitney St Unit 3
- 162 Whitney St Unit 164
- 133 Kenyon St
- 138 Kenyon St
- 168 Whitney St Unit 170
- 148 Whitney St
- 154 Whitney St Unit 156
- 158 Whitney St Unit 160