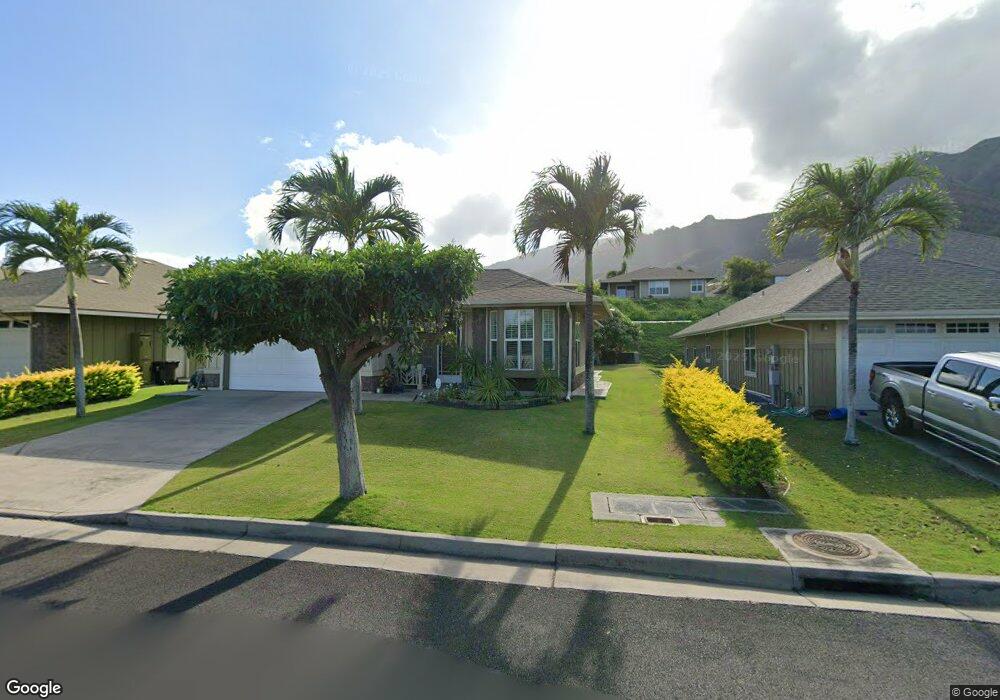
153 Kinohi Loa Loop Unit Home Site 39 Wailuku, HI 96793
Estimated Value: $1,260,751 - $1,312,000
3
Beds
2
Baths
1,703
Sq Ft
$758/Sq Ft
Est. Value
About This Home
This home is located at 153 Kinohi Loa Loop Unit Home Site 39, Wailuku, HI 96793 and is currently estimated at $1,291,438, approximately $758 per square foot. 153 Kinohi Loa Loop Unit Home Site 39 is a home located in Maui County with nearby schools including Puu Kukui Elementary School, Iao Intermediate School, and Henry Perrine Baldwin High School.
Ownership History
Date
Name
Owned For
Owner Type
Purchase Details
Closed on
Mar 9, 2017
Sold by
Jarnesky Morris D and Jarnesky Theresa A
Bought by
Jarnesky Morris D and Jarnesky Theresa A
Current Estimated Value
Purchase Details
Closed on
Sep 30, 2008
Sold by
Jarnesky Morris Damien and Jarnesky Theresa Ann
Bought by
Jarnesky Morris D and Jarnesky Theresa A
Purchase Details
Closed on
Mar 24, 2008
Sold by
Akolea At Kehalani Llc
Bought by
Jarnesky Morris Damien and Jarnesky Theresa Ann
Home Financials for this Owner
Home Financials are based on the most recent Mortgage that was taken out on this home.
Original Mortgage
$80,000
Outstanding Balance
$50,504
Interest Rate
5.99%
Mortgage Type
Unknown
Estimated Equity
$1,240,934
Create a Home Valuation Report for This Property
The Home Valuation Report is an in-depth analysis detailing your home's value as well as a comparison with similar homes in the area
Home Values in the Area
Average Home Value in this Area
Purchase History
| Date | Buyer | Sale Price | Title Company |
|---|---|---|---|
| Jarnesky Morris D | -- | None Available | |
| Jarnesky Morris D | -- | None Available | |
| Jarnesky Morris D | -- | None Available | |
| Jarnesky Morris Damien | $640,600 | Tg |
Source: Public Records
Mortgage History
| Date | Status | Borrower | Loan Amount |
|---|---|---|---|
| Open | Jarnesky Morris Damien | $80,000 |
Source: Public Records
Tax History Compared to Growth
Tax History
| Year | Tax Paid | Tax Assessment Tax Assessment Total Assessment is a certain percentage of the fair market value that is determined by local assessors to be the total taxable value of land and additions on the property. | Land | Improvement |
|---|---|---|---|---|
| 2025 | $150 | $1,035,900 | $560,900 | $475,000 |
| 2024 | $150 | $869,600 | $416,900 | $452,700 |
| 2023 | $1,074 | $869,900 | $416,900 | $453,000 |
| 2022 | $1,074 | $736,800 | $325,900 | $410,900 |
| 2021 | $1,242 | $715,500 | $333,500 | $382,000 |
| 2020 | $1,312 | $722,700 | $333,500 | $389,200 |
| 2019 | $1,373 | $673,400 | $295,600 | $377,800 |
| 2018 | $1,332 | $667,400 | $254,400 | $413,000 |
| 2017 | $1,248 | $0 | $0 | $0 |
| 2016 | $1,137 | $621,200 | $237,400 | $383,800 |
| 2015 | $573 | $634,600 | $229,000 | $405,600 |
Source: Public Records
Map
Nearby Homes
- 160 Kinohi Loa Loop
- 67 Kinohi Loa Loop
- 563 Kauna Lipo Dr
- 629 Kauna Lipo Dr Unit 13
- 508 Kauna Lipo Dr Unit LOT 39
- 637 Kauna Lipo Dr Unit 14
- 673 Kauna Lipo Dr Unit 18
- 107 Kinohi Loa St
- 21 Kamauhalii Way Unit 1A
- 15 Kaloaloa Way Unit 7A
- 29 Maunaleo St
- 116 Hopoi Place Unit 57
- 124 Hopoi Place
- 101 Hopo'I Place Unit 51B
- 115 Nanu Place
- 33 Kokea St Unit 901
- 15 Awela Cir Unit 103
- 101 Kiha Place Unit Lot 41
- 41 Kokea St Unit 1003
- 66 Awela Cir Unit 2803
- 153 Kinohi Loa Loop
- 147 Kinohi Loa Loop
- 147 Kinohi Loa Loop Unit Home Site 38
- 159 Kinohi Loa Loop
- 159 Kinohi Loa Loop Unit Home Site 40
- 165 Kinohi Loa Loop
- 165 Kinohi Loa Loop Unit Lot 41
- 141 Kinohi Loa Loop
- 141 Kinohi Loa Loop Unit Home Site 37
- 79 Kinohi Loa Loop
- 87 Kinohi Loa Loop
- 87 Kinohi Loa Loop Unit Lot 48
- 87 Kinohi Loa Loop Unit Home Site 48
- 95 Kinohi Loa Loop
- 71 Kinohi Loa Loop
- 154 Kinohi Loa Loop
- 154 Kinohi Loa Loop Unit Lot 25
- 109 Kinohi Loa Loop Unit Home Site 50
- 160 Kinohi Loa Loop Unit Home Site 24