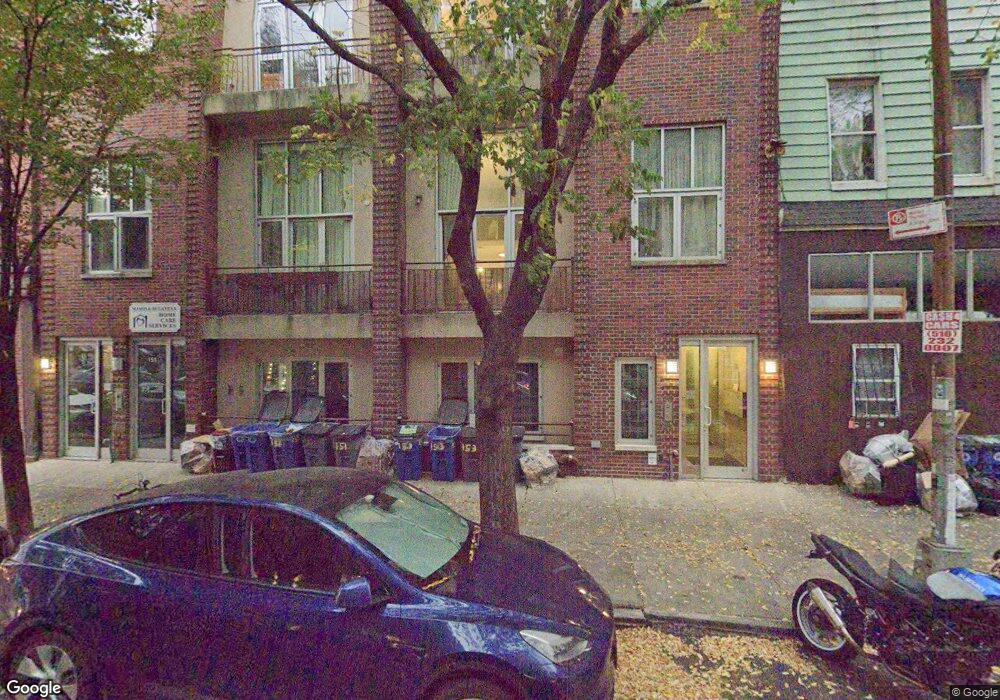
153 Manhattan Ave Unit 1B Brooklyn, NY 11206
Williamsburg NeighborhoodEstimated Value: $1,280,000 - $1,582,656
1
Bed
2
Baths
1,376
Sq Ft
$993/Sq Ft
Est. Value
About This Home
This home is located at 153 Manhattan Ave Unit 1B, Brooklyn, NY 11206 and is currently estimated at $1,366,914, approximately $993 per square foot. 153 Manhattan Ave Unit 1B is a home located in Kings County with nearby schools including P.S. 250 George H Lindsey and Bnos Chayil.
Ownership History
Date
Name
Owned For
Owner Type
Purchase Details
Closed on
Apr 16, 2019
Sold by
Tappan Luis E
Bought by
Maroulis Athena and Wisner Kristi
Current Estimated Value
Home Financials for this Owner
Home Financials are based on the most recent Mortgage that was taken out on this home.
Original Mortgage
$860,000
Outstanding Balance
$754,546
Interest Rate
4.3%
Mortgage Type
Purchase Money Mortgage
Estimated Equity
$612,368
Purchase Details
Closed on
Dec 17, 2007
Sold by
Nca Development Llc and Ppk Development Llc
Bought by
Tappan Luis E
Home Financials for this Owner
Home Financials are based on the most recent Mortgage that was taken out on this home.
Original Mortgage
$417,000
Interest Rate
6.27%
Mortgage Type
Purchase Money Mortgage
Create a Home Valuation Report for This Property
The Home Valuation Report is an in-depth analysis detailing your home's value as well as a comparison with similar homes in the area
Home Values in the Area
Average Home Value in this Area
Purchase History
| Date | Buyer | Sale Price | Title Company |
|---|---|---|---|
| Maroulis Athena | $1,075,000 | -- | |
| Maroulis Athena | $1,075,000 | -- | |
| Tappan Luis E | $590,000 | -- | |
| Tappan Luis E | $590,000 | -- |
Source: Public Records
Mortgage History
| Date | Status | Borrower | Loan Amount |
|---|---|---|---|
| Open | Maroulis Athena | $860,000 | |
| Closed | Maroulis Athena | $860,000 | |
| Previous Owner | Tappan Luis E | $417,000 |
Source: Public Records
Tax History Compared to Growth
Tax History
| Year | Tax Paid | Tax Assessment Tax Assessment Total Assessment is a certain percentage of the fair market value that is determined by local assessors to be the total taxable value of land and additions on the property. | Land | Improvement |
|---|---|---|---|---|
| 2025 | $82 | $107,212 | $8,452 | $98,760 |
| 2024 | $82 | $102,030 | $8,452 | $93,578 |
| 2023 | $80 | $93,259 | $8,452 | $84,807 |
| 2022 | $80 | $87,618 | $8,452 | $79,166 |
| 2021 | $80 | $73,156 | $8,452 | $64,704 |
| 2020 | $39 | $81,894 | $8,452 | $73,442 |
| 2019 | $82 | $79,711 | $8,452 | $71,259 |
| 2018 | $83 | $76,915 | $8,452 | $68,463 |
| 2017 | $83 | $68,279 | $8,452 | $59,827 |
| 2016 | $84 | $56,391 | $8,452 | $47,939 |
| 2015 | $66 | $53,802 | $8,452 | $45,350 |
| 2014 | $66 | $53,817 | $8,452 | $45,365 |
Source: Public Records
Map
Nearby Homes
- 151 Manhattan Ave Unit 2B
- 135 Johnson Ave Unit 1
- 56 Meserole St
- 150 E 56th St Unit 2A
- 63 Stagg St Unit 1A
- 390 Lorimer St Unit 2G
- 29 Montrose Ave Unit 4B
- 648 Grand St Unit 4B
- 206 Montrose Ave Unit 3A
- 110 McKibbin St
- 181 Maujer St
- 738 Grand St Unit 3A
- 250 Manhattan Ave Unit 2 R
- 250 Manhattan Ave Unit 4 F
- 245 Manhattan Ave Unit 2-A
- 97 Seigel St Unit 2A
- 97 Seigel St Unit PH
- 97 Seigel St Unit 2R
- 97 Seigel St Unit 4A
- 97 Seigel St
- 153 Manhattan Ave Unit 4B
- 153 Manhattan Ave Unit 4A
- 153 Manhattan Ave Unit 3B
- 153 Manhattan Ave Unit 3A
- 153 Manhattan Ave Unit 2B
- 153 Manhattan Ave Unit 2A
- 153 Manhattan Ave Unit 1A
- 153 Manhattan Ave Unit PH-B
- 153 Manhattan Ave Unit 1
- 151 Manhattan Ave Unit 4A
- 151 Manhattan Ave Unit 3A
- 151 Manhattan Ave Unit 1
- 151 Manhattan Ave
- 151 Manhattan Ave Unit 3
- 149 Manhattan Ave
- 157 Manhattan Ave
- 147 Manhattan Ave Unit 4B
- 147 Manhattan Ave Unit 4A