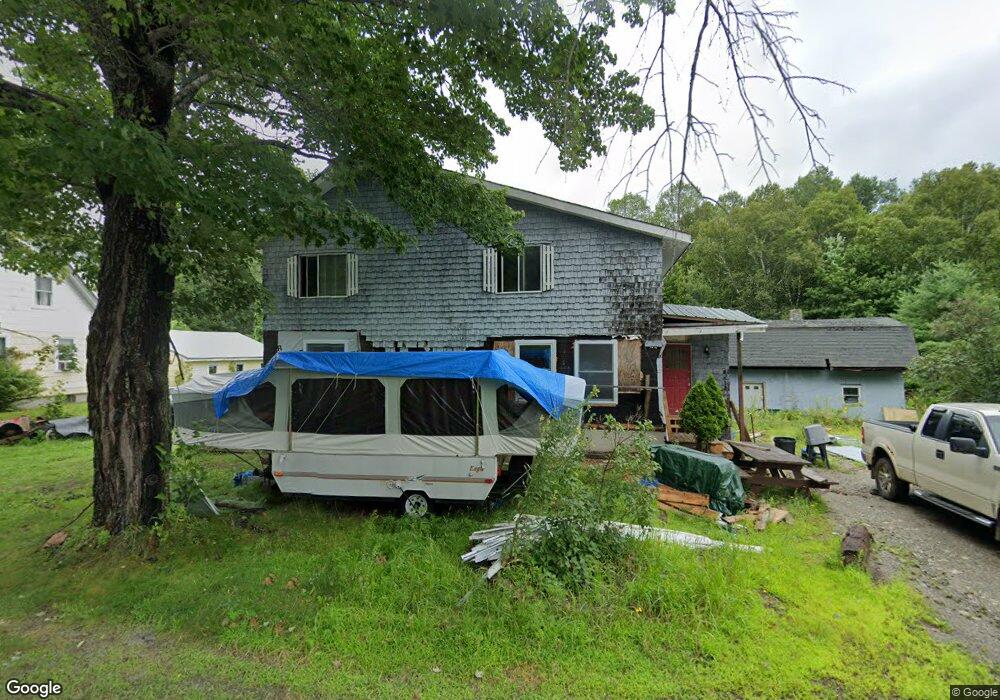
153 Medway Rd Millinocket, ME 04462
3
Beds
1
Bath
1,704
Sq Ft
0.43
Acres Lot
About This Home
This home is located at 153 Medway Rd, Millinocket, ME 04462. 153 Medway Rd is a home located in Penobscot County with nearby schools including Granite Street School and Stearns Junior/Senior High School.
Ownership History
Date
Name
Owned For
Owner Type
Purchase Details
Closed on
Jul 24, 2025
Sold by
Gray Lyle L
Bought by
Murphy Shaun D
Home Financials for this Owner
Home Financials are based on the most recent Mortgage that was taken out on this home.
Original Mortgage
$25,600
Outstanding Balance
$25,398
Interest Rate
6.84%
Mortgage Type
New Conventional
Purchase Details
Closed on
Jul 10, 2025
Sold by
Gray Richard A
Bought by
Gray Lyle L
Home Financials for this Owner
Home Financials are based on the most recent Mortgage that was taken out on this home.
Original Mortgage
$25,600
Outstanding Balance
$25,398
Interest Rate
6.84%
Mortgage Type
New Conventional
Create a Home Valuation Report for This Property
The Home Valuation Report is an in-depth analysis detailing your home's value as well as a comparison with similar homes in the area
Home Values in the Area
Average Home Value in this Area
Purchase History
We collect this data history from publicly available records. To have your information removed, we recommend requesting removal directly through your county’s website.
| Date | Buyer | Sale Price | Title Company |
|---|---|---|---|
| Murphy Shaun D | $32,000 | -- | |
| Murphy Shaun D | $32,000 | -- | |
| Gray Lyle L | -- | -- | |
| Gray Lyle L | -- | -- |
Source: Public Records
Mortgage History
We collect this data history from publicly available records. To have your information removed, we recommend requesting removal directly through your county’s website.
| Date | Status | Borrower | Loan Amount |
|---|---|---|---|
| Open | Murphy Shaun D | $25,600 | |
| Closed | Murphy Shaun D | $25,600 |
Source: Public Records
Tax History
| Year | Tax Paid | Tax Assessment Tax Assessment Total Assessment is a certain percentage of the fair market value that is determined by local assessors to be the total taxable value of land and additions on the property. | Land | Improvement |
|---|---|---|---|---|
| 2025 | $1,951 | $86,600 | $14,700 | $71,900 |
| 2024 | $1,951 | $70,700 | $8,700 | $62,000 |
| 2023 | $1,644 | $58,300 | $8,700 | $49,600 |
| 2022 | $1,552 | $52,600 | $8,700 | $43,900 |
| 2021 | $1,580 | $48,600 | $8,700 | $39,900 |
| 2020 | $1,574 | $46,300 | $8,700 | $37,600 |
| 2019 | $1,089 | $33,000 | $8,700 | $24,300 |
| 2018 | $1,073 | $33,000 | $8,700 | $24,300 |
| 2017 | $1,066 | $33,000 | $8,700 | $24,300 |
| 2016 | $0 | $59,600 | $8,700 | $50,900 |
| 2015 | -- | $33,000 | $8,700 | $24,300 |
| 2014 | -- | $59,600 | $8,700 | $50,900 |
Source: Public Records
Map
Nearby Homes
Your Personal Tour Guide
Ask me questions while you tour the home.