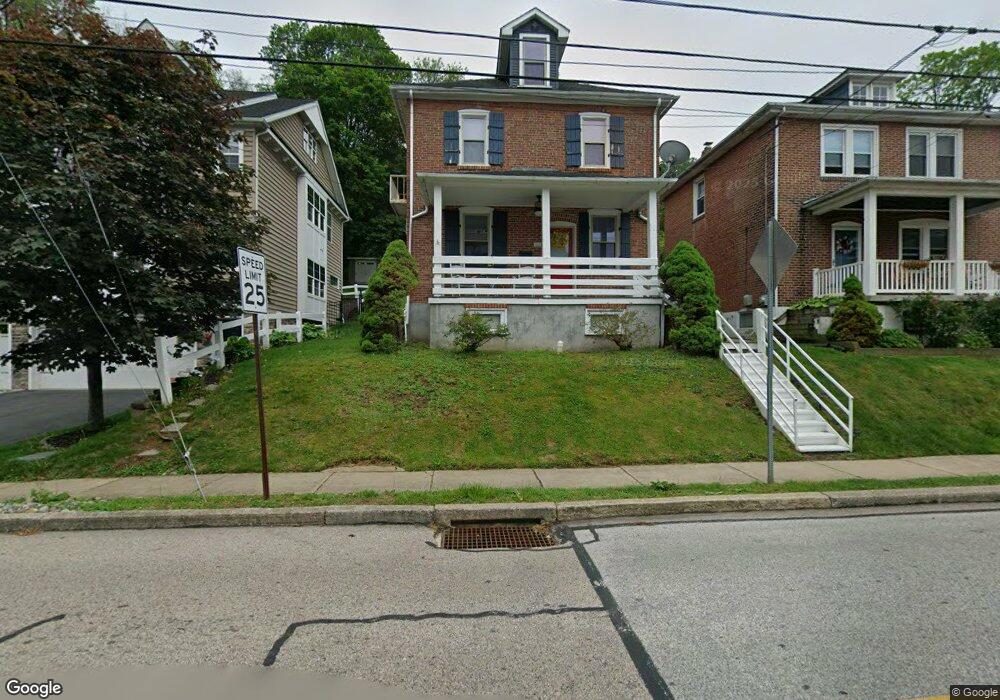
153 Moorehead Ave Conshohocken, PA 19428
Estimated Value: $344,000 - $430,000
3
Beds
1
Bath
1,248
Sq Ft
$315/Sq Ft
Est. Value
About This Home
This home is located at 153 Moorehead Ave, Conshohocken, PA 19428 and is currently estimated at $393,235, approximately $315 per square foot. 153 Moorehead Ave is a home located in Montgomery County with nearby schools including Bridgeport Elementary School, Upper Merion Middle School, and Upper Merion High School.
Ownership History
Date
Name
Owned For
Owner Type
Purchase Details
Closed on
Feb 27, 2008
Sold by
Kaune Amanda S and Riley Amanda S
Bought by
Kaune Amanda S and Kaune Douglas
Current Estimated Value
Home Financials for this Owner
Home Financials are based on the most recent Mortgage that was taken out on this home.
Original Mortgage
$192,000
Outstanding Balance
$119,485
Interest Rate
5.72%
Estimated Equity
$273,750
Purchase Details
Closed on
Sep 29, 2004
Sold by
Vansciver George Mason and Faidley Christina L
Bought by
Riley Amanda S
Purchase Details
Closed on
Jun 4, 2004
Sold by
Leflar David F
Bought by
Vansciver George M and Faidley Christina L
Home Financials for this Owner
Home Financials are based on the most recent Mortgage that was taken out on this home.
Original Mortgage
$156,000
Interest Rate
6.12%
Purchase Details
Closed on
Sep 27, 2001
Sold by
Zorkowski Helen
Bought by
Leflar David F
Create a Home Valuation Report for This Property
The Home Valuation Report is an in-depth analysis detailing your home's value as well as a comparison with similar homes in the area
Home Values in the Area
Average Home Value in this Area
Purchase History
| Date | Buyer | Sale Price | Title Company |
|---|---|---|---|
| Kaune Amanda S | -- | None Available | |
| Riley Amanda S | $245,000 | -- | |
| Vansciver George M | $195,000 | -- | |
| Leflar David F | $30,000 | -- |
Source: Public Records
Mortgage History
| Date | Status | Borrower | Loan Amount |
|---|---|---|---|
| Open | Kaune Amanda S | $192,000 | |
| Previous Owner | Vansciver George M | $156,000 | |
| Closed | Riley Amanda S | $0 |
Source: Public Records
Tax History
| Year | Tax Paid | Tax Assessment Tax Assessment Total Assessment is a certain percentage of the fair market value that is determined by local assessors to be the total taxable value of land and additions on the property. | Land | Improvement |
|---|---|---|---|---|
| 2025 | $2,688 | $94,790 | $37,930 | $56,860 |
| 2024 | $2,688 | $94,790 | $37,930 | $56,860 |
| 2023 | $2,585 | $94,790 | $37,930 | $56,860 |
| 2022 | $2,489 | $94,790 | $37,930 | $56,860 |
| 2021 | $2,461 | $94,790 | $37,930 | $56,860 |
| 2020 | $2,405 | $94,790 | $37,930 | $56,860 |
| 2019 | $2,362 | $94,790 | $37,930 | $56,860 |
Source: Public Records
Map
Nearby Homes
- 221 Ford St Unit 24
- 1119 Riverview Ln
- 1018 Riverview Ln
- 505 Apple St
- 407 Merion Hill Ln
- 406 Merion Hill Ln
- 1300 Valley Rd
- 205 Front St
- 1335 Valley Rd
- 308 Brittmore Ave
- 102 Campbell Dr
- 1220 Valley Rd
- 200 W Elm St Unit 1319
- 200 W Elm St Unit 1112
- 200 W Elm St Unit 1428
- 300 W Elm St Unit 2134
- 300 W Elm St Unit 2236
- 300 W Elm St Unit 2322
- 300 W Elm St Unit 2320
- 300 W Elm St Unit 2424
- 151 Moorehead Ave
- 149 Moorehead Ave
- 155 Moorehead Ave
- 145 Moorehead Ave
- 159 Moorehead Ave
- 140 Moorehead Ave
- 130 Moorehead Ave
- 142 Moorehead Ave
- 141 Moorehead Ave
- 132 Moorehead Ave
- 144 Moorehead Ave
- 150 Moorehead Ave
- 163 Moorehead Ave
- 134 Moorehead Ave
- 152 Moorehead Ave
- 136 Moorehead Ave
- 154 Moorehead Ave
- 120 Moorehead Ave
- 148 Moorehead Ave
- 138 Moorehead Ave
Your Personal Tour Guide
Ask me questions while you tour the home.