
Seller's Agent in 2026
Linde Moore
Keller Williams Realty First Atlanta
(404) 856-3566
1 in this area
526 Total Sales
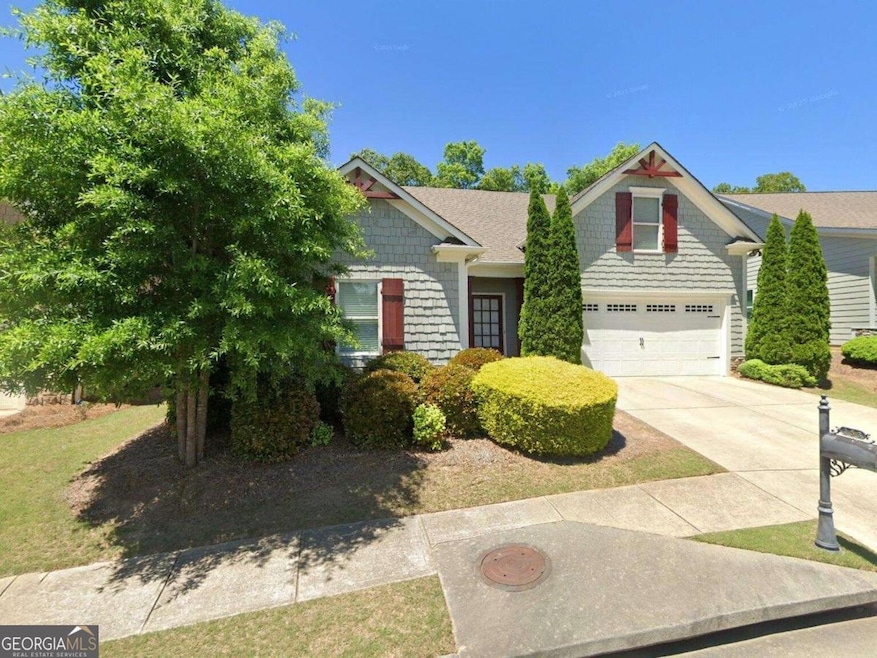
Refined single-level living in Lantern Walk. This impeccably kept 4-bedroom, 2-bath ranch welcomes with a grand, open living room anchored by a gas fireplace and effortless flow to the dining area and chef's kitchen. A generous walk-in pantry keeps the kitchen pristine and organized for everyday ease or elegant entertaining. The serene primary suite is a true retreat, offering a spacious walk-in closet and a spa-inspired bath with dual granite vanities, a soaking tub, and a separate walk-in shower. Three additional bedrooms provide flexibility for guests, office, or fitness. Step outside to a screened porch overlooking a private, fenced backyard-perfect for quiet mornings or alfresco evenings. A large 2-car garage affords abundant storage and utility. Enjoy low-maintenance living with HOA including front-yard mowing. Moments to downtown Ball Ground's boutiques, home stores, restaurants, and brewery, with swift access to I-575 for effortless commuting. Served by Cherokee County schools, this residence blends elegant comfort with exceptional convenience. Schedule your private tour today!
Last Agent to Sell the Property
Keller Williams Realty First Atlanta License #354599 Listed on: 10/29/2025
| Date | Type | Sale Price | Title Company |
|---|---|---|---|
| Warranty Deed | -- | -- | |
| Warranty Deed | $141,500 | -- | |
| Warranty Deed | $141,500 | -- | |
| Warranty Deed | $27,300 | -- | |
| Foreclosure Deed | $120,000 | -- |
| Date | Status | Loan Amount | Loan Type |
|---|---|---|---|
| Previous Owner | $113,200 | New Conventional | |
| Previous Owner | $89,483 | New Conventional |
| Date | Event | Price | List to Sale | Price per Sq Ft |
|---|---|---|---|---|
| 02/23/2026 02/23/26 | Sold | $340,000 | -2.9% | $213 / Sq Ft |
| 12/19/2025 12/19/25 | Price Changed | $350,000 | -2.5% | $220 / Sq Ft |
| 11/24/2025 11/24/25 | Price Changed | $359,000 | -4.3% | $225 / Sq Ft |
| 10/29/2025 10/29/25 | For Sale | $375,000 | -- | $235 / Sq Ft |
| Year | Tax Paid | Tax Assessment Tax Assessment Total Assessment is a certain percentage of the fair market value that is determined by local assessors to be the total taxable value of land and additions on the property. | Land | Improvement |
|---|---|---|---|---|
| 2025 | $3,688 | $123,000 | $27,200 | $95,800 |
| 2024 | $3,945 | $131,840 | $30,000 | $101,840 |
| 2023 | $3,737 | $124,880 | $26,000 | $98,880 |
| 2022 | $3,373 | $111,600 | $24,400 | $87,200 |
| 2021 | $2,877 | $87,120 | $22,000 | $65,120 |
| 2020 | $2,793 | $83,600 | $19,200 | $64,400 |
| 2019 | $2,520 | $76,080 | $17,600 | $58,480 |
| 2018 | $2,253 | $67,080 | $16,800 | $50,280 |
| 2017 | $2,212 | $164,800 | $15,160 | $50,760 |
| 2016 | $2,194 | $161,200 | $13,200 | $51,280 |
| 2015 | $2,050 | $148,400 | $13,200 | $46,160 |
| 2014 | $1,749 | $125,500 | $10,800 | $39,400 |
Seller's Agent in 2026
Linde Moore
Keller Williams Realty First Atlanta
(404) 856-3566
1 in this area
526 Total Sales
Buyer's Agent in 2026
Karen Lance
Better Homes and Gardens Real Estate
(770) 401-4256
44 in this area
258 Total Sales
Source: Georgia MLS
MLS Number: 10629467
APN: 03N01B-00000-052-000
Disclaimer: Certain information contained herein is derived from information provided by parties other than Homes.com. All information provided is deemed reliable, but is not guaranteed to be accurate and should be independently verified.
![]() The data relating to real estate for sale on this web site comes in part from the Broker Reciprocity Program of Georgia MLS. Real estate listings held by brokerage firms other than Redfin are marked with the Broker Reciprocity logo and detailed information about them includes the name of the listing brokers. Information deemed reliable but not guaranteed. Copyright 2026 Georgia MLS. All rights reserved.
The data relating to real estate for sale on this web site comes in part from the Broker Reciprocity Program of Georgia MLS. Real estate listings held by brokerage firms other than Redfin are marked with the Broker Reciprocity logo and detailed information about them includes the name of the listing brokers. Information deemed reliable but not guaranteed. Copyright 2026 Georgia MLS. All rights reserved.
Ask me questions while you tour the home.