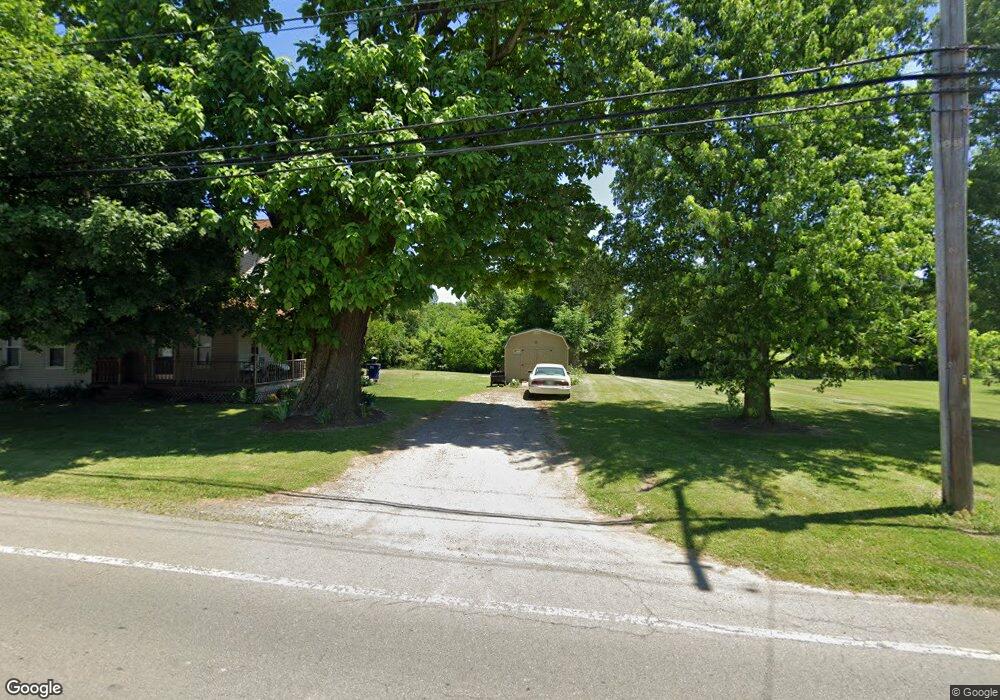
153 N Gamble St Shelby, OH 44875
--
Bed
2
Baths
--
Sq Ft
0.76
Acres
About This Home
This home is located at 153 N Gamble St, Shelby, OH 44875. 153 N Gamble St is a home located in Richland County with nearby schools including St. Mary's School.
Ownership History
Date
Name
Owned For
Owner Type
Purchase Details
Closed on
Jun 9, 2009
Sold by
Tanner Bruce E
Bought by
City Of Shelby
Purchase Details
Closed on
May 14, 2007
Sold by
Bank Of New York
Bought by
Tanner Bruce E
Home Financials for this Owner
Home Financials are based on the most recent Mortgage that was taken out on this home.
Original Mortgage
$59,850
Interest Rate
6.21%
Mortgage Type
Purchase Money Mortgage
Purchase Details
Closed on
May 27, 2006
Sold by
Scott Joseph J and Scott Virginia D
Bought by
Scott Joseph J and Scott Virginia D
Purchase Details
Closed on
Jan 8, 1998
Sold by
Patton Paul E
Bought by
Gosser Kevin P and Gosser Heidi L
Home Financials for this Owner
Home Financials are based on the most recent Mortgage that was taken out on this home.
Original Mortgage
$78,837
Interest Rate
7.26%
Mortgage Type
FHA
Purchase Details
Closed on
Mar 3, 1995
Sold by
Scott Joseph J
Bought by
Patton Paul E
Home Financials for this Owner
Home Financials are based on the most recent Mortgage that was taken out on this home.
Original Mortgage
$52,000
Interest Rate
6.75%
Mortgage Type
New Conventional
Create a Home Valuation Report for This Property
The Home Valuation Report is an in-depth analysis detailing your home's value as well as a comparison with similar homes in the area
Home Values in the Area
Average Home Value in this Area
Purchase History
| Date | Buyer | Sale Price | Title Company |
|---|---|---|---|
| City Of Shelby | -- | Chicago Title | |
| Tanner Bruce E | $66,500 | Accommodation | |
| Scott Joseph J | -- | Urban Title | |
| Gosser Kevin P | $79,500 | -- | |
| Patton Paul E | $65,000 | -- |
Source: Public Records
Mortgage History
| Date | Status | Borrower | Loan Amount |
|---|---|---|---|
| Previous Owner | Tanner Bruce E | $59,850 | |
| Previous Owner | Gosser Kevin P | $78,837 | |
| Previous Owner | Patton Paul E | $52,000 |
Source: Public Records
Tax History Compared to Growth
Tax History
| Year | Tax Paid | Tax Assessment Tax Assessment Total Assessment is a certain percentage of the fair market value that is determined by local assessors to be the total taxable value of land and additions on the property. | Land | Improvement |
|---|---|---|---|---|
| 2024 | -- | $2,630 | $2,630 | $0 |
| 2023 | $0 | $2,630 | $2,630 | $0 |
| 2022 | $0 | $2,380 | $2,380 | $0 |
| 2021 | $0 | $2,380 | $2,380 | $0 |
| 2020 | $0 | $2,380 | $2,380 | $0 |
| 2019 | $0 | $2,380 | $2,380 | $0 |
| 2018 | $0 | $2,380 | $2,380 | $0 |
| 2017 | $0 | $2,380 | $2,380 | $0 |
| 2016 | -- | $2,380 | $2,380 | $0 |
| 2015 | -- | $2,380 | $2,380 | $0 |
| 2014 | -- | $2,380 | $2,380 | $0 |
| 2012 | -- | $2,380 | $2,380 | $0 |
Source: Public Records
Map
Nearby Homes