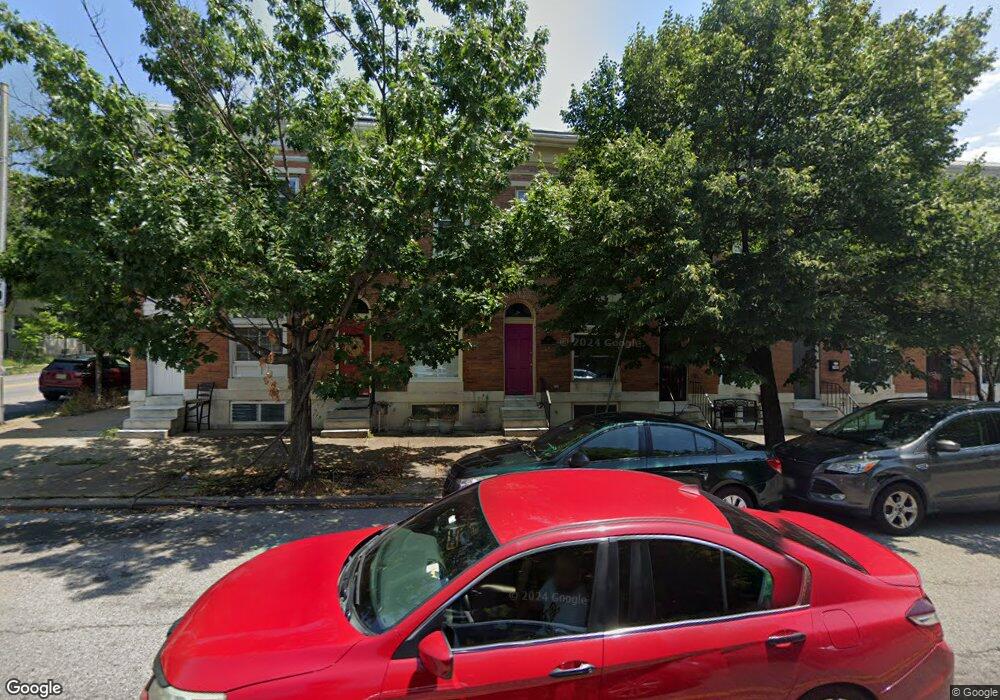
153 N Linwood Ave Baltimore, MD 21224
Patterson Park NeighborhoodEstimated Value: $247,995 - $290,000
2
Beds
3
Baths
1,332
Sq Ft
$202/Sq Ft
Est. Value
About This Home
This home is located at 153 N Linwood Ave, Baltimore, MD 21224 and is currently estimated at $268,998, approximately $201 per square foot. 153 N Linwood Ave is a home located in Baltimore City with nearby schools including Highlandtown Elementary/Middle School No. 215, Booker T. Washington Middle School, and Paul Laurence Dunbar High School.
Ownership History
Date
Name
Owned For
Owner Type
Purchase Details
Closed on
Mar 29, 2018
Sold by
A & P Llc
Bought by
Castagnola Michael
Current Estimated Value
Purchase Details
Closed on
Oct 13, 2017
Sold by
Tami L Rosenberg
Bought by
Castagnola Michael
Home Financials for this Owner
Home Financials are based on the most recent Mortgage that was taken out on this home.
Original Mortgage
$172,928
Interest Rate
3.91%
Purchase Details
Closed on
Sep 1, 2011
Sold by
Klein Dennis M
Bought by
Rosenberg Tami L and Rosenberg Joshua
Purchase Details
Closed on
Jan 29, 2004
Sold by
Patterson Park Community
Bought by
Klein Dennis M and Klein Gerald I
Purchase Details
Closed on
Apr 12, 2001
Sold by
Secretary Of Housing & Urban
Bought by
Patterson Park Community and Development , Corp
Purchase Details
Closed on
May 23, 2000
Sold by
Burris Theresa L
Bought by
Secretary Of Housing & Urban and Development
Create a Home Valuation Report for This Property
The Home Valuation Report is an in-depth analysis detailing your home's value as well as a comparison with similar homes in the area
Home Values in the Area
Average Home Value in this Area
Purchase History
| Date | Buyer | Sale Price | Title Company |
|---|---|---|---|
| Castagnola Michael | $600 | None Available | |
| Castagnola Michael | $165,000 | -- | |
| Rosenberg Tami L | $116,500 | -- | |
| Rosenberg Tami L | $116,500 | -- | |
| Klein Dennis M | $165,000 | -- | |
| Patterson Park Community | $20,000 | -- | |
| Secretary Of Housing & Urban | $39,606 | -- |
Source: Public Records
Mortgage History
| Date | Status | Borrower | Loan Amount |
|---|---|---|---|
| Previous Owner | Castagnola Michael | $172,928 | |
| Previous Owner | Castagnola Michael | -- |
Source: Public Records
Tax History Compared to Growth
Tax History
| Year | Tax Paid | Tax Assessment Tax Assessment Total Assessment is a certain percentage of the fair market value that is determined by local assessors to be the total taxable value of land and additions on the property. | Land | Improvement |
|---|---|---|---|---|
| 2025 | $5,747 | $205,000 | $50,000 | $155,000 |
| 2024 | $5,747 | $244,667 | $0 | $0 |
| 2023 | $6,061 | $258,033 | $0 | $0 |
| 2022 | $5,768 | $244,400 | $50,000 | $194,400 |
| 2021 | $5,143 | $217,933 | $0 | $0 |
| 2020 | $3,511 | $191,467 | $0 | $0 |
| 2019 | $4,536 | $212,700 | $50,000 | $162,700 |
| 2018 | $4,613 | $212,700 | $50,000 | $162,700 |
| 2017 | $4,665 | $212,700 | $0 | $0 |
| 2016 | $5,161 | $215,700 | $0 | $0 |
| 2015 | $5,161 | $215,700 | $0 | $0 |
| 2014 | $5,161 | $215,700 | $0 | $0 |
Source: Public Records
Map
Nearby Homes
- 128 N Curley St
- 2934 E Fayette St
- 119 N Curley St
- 163 N Streeper St
- 109 N Linwood Ave
- 149 N Potomac St
- 200 N Linwood Ave
- 162 N Decker Ave
- 35 N Linwood Ave
- 143 N Kenwood Ave
- 133 N Kenwood Ave
- 112 N Decker Ave
- 211 N Streeper St
- 212 N Streeper St
- 122 N Ellwood Ave
- 120 N Kenwood Ave
- 102 N Ellwood Ave
- 408 N Curley St
- 423 N Curley St
- 2718 E Fairmount Ave
- 149 N Linwood Ave
- 147 N Linwood Ave
- 151 N Linwood Ave
- 145 N Linwood Ave
- 143 N Linwood Ave
- 155 N Linwood Ave
- 141 N Linwood Ave
- 157 N Linwood Ave
- 139 N Linwood Ave
- 154 N Curley St
- 156 N Curley St
- 152 N Curley St
- 158 N Curley St
- 160 N Curley St
- 150 N Curley St
- 137 N Linwood Ave
- 162 N Curley St
- 148 N Curley St
- 146 N Curley St
- 164 N Curley St