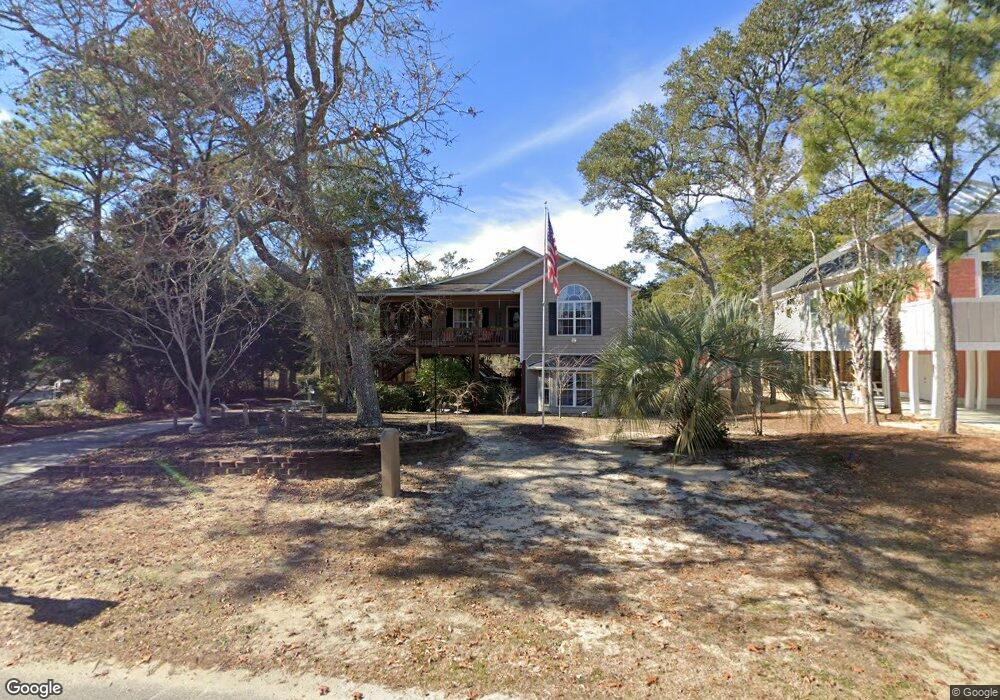
153 NE 4th St Oak Island, NC 28465
Estimated Value: $574,000 - $712,000
3
Beds
3
Baths
1,301
Sq Ft
$486/Sq Ft
Est. Value
About This Home
This home is located at 153 NE 4th St, Oak Island, NC 28465 and is currently estimated at $632,306, approximately $486 per square foot. 153 NE 4th St is a home located in Brunswick County with nearby schools including Southport Elementary School, South Brunswick Middle School, and South Brunswick High School.
Ownership History
Date
Name
Owned For
Owner Type
Purchase Details
Closed on
Jun 1, 2015
Sold by
Sherry Richard M and Sherry Louise C
Bought by
Parker Jeffrey J and Parker Hilda
Current Estimated Value
Home Financials for this Owner
Home Financials are based on the most recent Mortgage that was taken out on this home.
Original Mortgage
$204,008
Outstanding Balance
$156,587
Interest Rate
3.5%
Mortgage Type
FHA
Estimated Equity
$475,719
Purchase Details
Closed on
Sep 1, 2004
Bought by
Sherry Richard Et Louise
Create a Home Valuation Report for This Property
The Home Valuation Report is an in-depth analysis detailing your home's value as well as a comparison with similar homes in the area
Home Values in the Area
Average Home Value in this Area
Purchase History
| Date | Buyer | Sale Price | Title Company |
|---|---|---|---|
| Parker Jeffrey J | $231,000 | None Available | |
| Sherry Richard Et Louise | $216,000 | -- |
Source: Public Records
Mortgage History
| Date | Status | Borrower | Loan Amount |
|---|---|---|---|
| Open | Parker Jeffrey J | $204,008 |
Source: Public Records
Tax History Compared to Growth
Tax History
| Year | Tax Paid | Tax Assessment Tax Assessment Total Assessment is a certain percentage of the fair market value that is determined by local assessors to be the total taxable value of land and additions on the property. | Land | Improvement |
|---|---|---|---|---|
| 2025 | $2,316 | $553,940 | $165,380 | $388,560 |
| 2024 | $2,316 | $553,940 | $165,380 | $388,560 |
| 2023 | $1,776 | $553,940 | $165,380 | $388,560 |
| 2022 | $1,776 | $304,080 | $86,700 | $217,380 |
| 2021 | $1,746 | $304,080 | $86,700 | $217,380 |
| 2020 | $1,721 | $304,080 | $86,700 | $217,380 |
| 2019 | $1,721 | $90,130 | $86,700 | $3,430 |
| 2018 | $1,463 | $51,360 | $47,180 | $4,180 |
| 2017 | $1,463 | $51,360 | $47,180 | $4,180 |
| 2016 | $1,614 | $55,470 | $47,180 | $8,290 |
| 2015 | $1,614 | $288,340 | $47,180 | $241,160 |
| 2014 | $1,272 | $242,892 | $57,380 | $185,512 |
Source: Public Records
Map
Nearby Homes