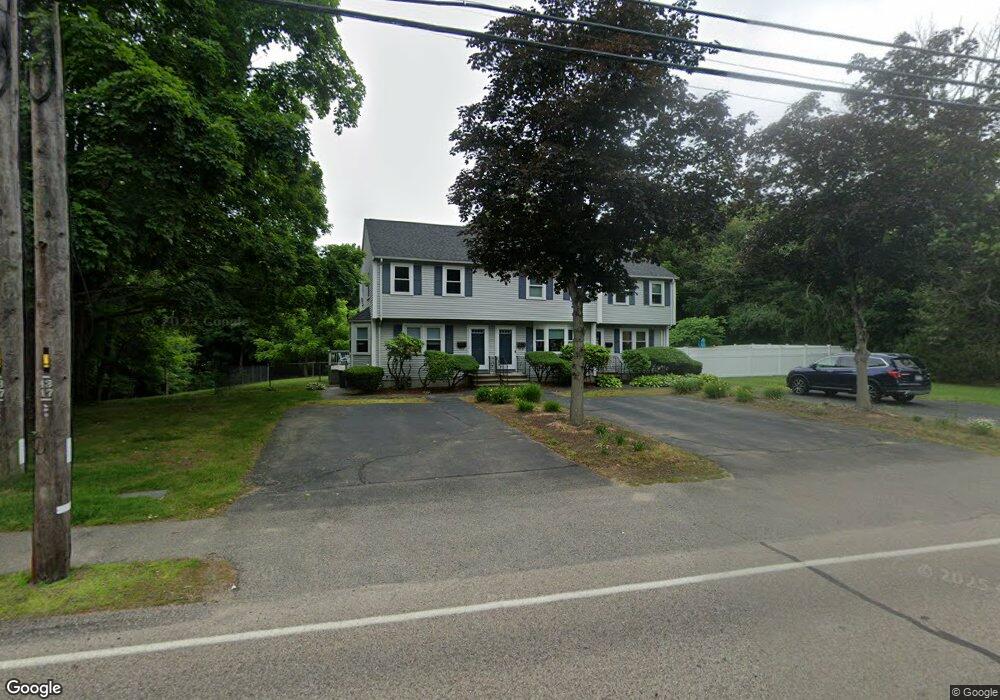
153 North St Unit B Walpole, MA 02081
Estimated Value: $450,512 - $509,000
2
Beds
2
Baths
972
Sq Ft
$487/Sq Ft
Est. Value
About This Home
This home is located at 153 North St Unit B, Walpole, MA 02081 and is currently estimated at $473,378, approximately $487 per square foot. 153 North St Unit B is a home located in Norfolk County with nearby schools including Fisher School, Walpole Middle School, and Walpole High School.
Ownership History
Date
Name
Owned For
Owner Type
Purchase Details
Closed on
Oct 3, 2024
Sold by
Cimeno Donna J
Bought by
Kmc T T and Kmc Cimeno
Current Estimated Value
Purchase Details
Closed on
Jan 12, 2007
Sold by
Andella Mario V and Andella Phyllis M
Bought by
Cimeno Donna J
Home Financials for this Owner
Home Financials are based on the most recent Mortgage that was taken out on this home.
Original Mortgage
$75,000
Interest Rate
6.18%
Mortgage Type
Purchase Money Mortgage
Purchase Details
Closed on
Sep 27, 2004
Sold by
Shank Gezina M
Bought by
Andella Mario V and Andella Phyllis M
Home Financials for this Owner
Home Financials are based on the most recent Mortgage that was taken out on this home.
Original Mortgage
$211,600
Interest Rate
5.89%
Mortgage Type
Purchase Money Mortgage
Create a Home Valuation Report for This Property
The Home Valuation Report is an in-depth analysis detailing your home's value as well as a comparison with similar homes in the area
Home Values in the Area
Average Home Value in this Area
Purchase History
| Date | Buyer | Sale Price | Title Company |
|---|---|---|---|
| Kmc T T | -- | None Available | |
| Kmc T T | -- | None Available | |
| Cimeno Donna J | $270,000 | -- | |
| Cimeno Donna J | $270,000 | -- | |
| Andella Mario V | $264,500 | -- | |
| Andella Mario | $264,500 | -- |
Source: Public Records
Mortgage History
| Date | Status | Borrower | Loan Amount |
|---|---|---|---|
| Previous Owner | Andella Mario V | $16,000 | |
| Previous Owner | Andella Mario V | $75,000 | |
| Previous Owner | Cimeno Donna J | $75,000 | |
| Previous Owner | Andella Mario | $211,600 |
Source: Public Records
Tax History
| Year | Tax Paid | Tax Assessment Tax Assessment Total Assessment is a certain percentage of the fair market value that is determined by local assessors to be the total taxable value of land and additions on the property. | Land | Improvement |
|---|---|---|---|---|
| 2025 | $4,721 | $368,000 | $0 | $368,000 |
| 2024 | $4,546 | $343,900 | $0 | $343,900 |
| 2023 | $4,382 | $315,500 | $0 | $315,500 |
| 2022 | $4,147 | $286,800 | $0 | $286,800 |
| 2021 | $4,131 | $278,400 | $0 | $278,400 |
| 2020 | $3,933 | $262,400 | $0 | $262,400 |
| 2019 | $3,847 | $254,800 | $0 | $254,800 |
| 2018 | $3,671 | $240,400 | $0 | $240,400 |
| 2017 | $3,576 | $233,300 | $0 | $233,300 |
| 2016 | $3,559 | $228,700 | $0 | $228,700 |
| 2015 | $3,451 | $219,800 | $0 | $219,800 |
| 2014 | $3,398 | $215,600 | $0 | $215,600 |
Source: Public Records
Map
Nearby Homes
- 41 Gill St Unit A
- 56 North St
- 246 Pemberton St
- 291 Plimpton St
- 881 Main St Unit 9
- 19 and 23 Arlington Ln
- 260 Elm St
- 224 School St Unit 9
- 241 Fisher St
- 1110 Main St
- 26 Dover Dr
- 486 Washington St
- 145 South St Unit 5
- 127 Clear Pond Dr
- 137 Clear Pond Dr
- 115 High St
- 17 Bridle Path
- 31 Sandtrap Cir Unit 500
- 10 Sandtrap Cir Unit 2
- 1391 Main St Unit 308