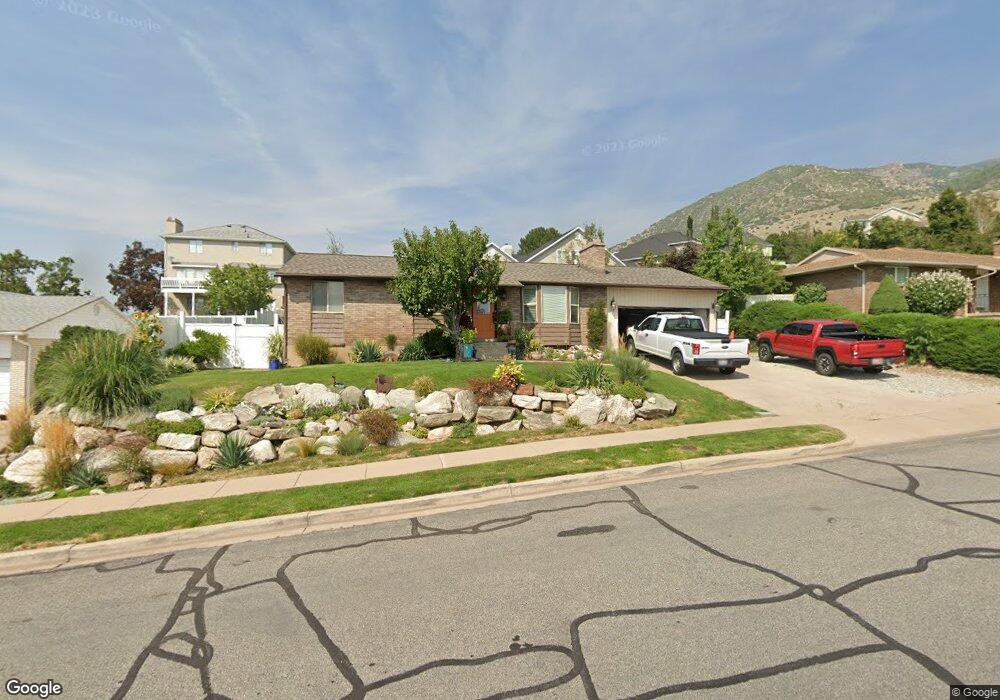
153 Peachtree Dr Centerville, UT 84014
Estimated Value: $525,000 - $556,000
5
Beds
2
Baths
2,250
Sq Ft
$242/Sq Ft
Est. Value
About This Home
This home is located at 153 Peachtree Dr, Centerville, UT 84014 and is currently estimated at $544,609, approximately $242 per square foot. 153 Peachtree Dr is a home located in Davis County with nearby schools including Stewart Elementary School, Centerville Jr High, and Viewmont High School.
Ownership History
Date
Name
Owned For
Owner Type
Purchase Details
Closed on
Aug 19, 2025
Sold by
Krantz Mark and Krantz Christene Hullinger
Bought by
Krantz Mark and Krantz Christene Hullinger
Current Estimated Value
Purchase Details
Closed on
Feb 18, 2017
Sold by
Boyle Jack C and Boyle Adrienne H
Bought by
Krantz Mark and Krantz Christine Hullinger
Home Financials for this Owner
Home Financials are based on the most recent Mortgage that was taken out on this home.
Original Mortgage
$260,200
Interest Rate
4.37%
Mortgage Type
FHA
Purchase Details
Closed on
Feb 17, 2017
Sold by
Krantz Mark and Krantz Christine Hullinger
Bought by
Krantz Mark and Krantz Christene Hullinger
Home Financials for this Owner
Home Financials are based on the most recent Mortgage that was taken out on this home.
Original Mortgage
$260,200
Interest Rate
4.37%
Mortgage Type
FHA
Purchase Details
Closed on
May 27, 1998
Sold by
Hales David A and Hales Kathy B
Bought by
Boyle Jack C and Boyle Adrienne H
Home Financials for this Owner
Home Financials are based on the most recent Mortgage that was taken out on this home.
Original Mortgage
$131,391
Interest Rate
7.13%
Mortgage Type
FHA
Create a Home Valuation Report for This Property
The Home Valuation Report is an in-depth analysis detailing your home's value as well as a comparison with similar homes in the area
Purchase History
| Date | Buyer | Sale Price | Title Company |
|---|---|---|---|
| Krantz Mark | -- | None Listed On Document | |
| Krantz Mark | -- | Us Title | |
| Krantz Mark | -- | Us Title | |
| Boyle Jack C | -- | Bonneville Title Company |
Source: Public Records
Mortgage History
| Date | Status | Borrower | Loan Amount |
|---|---|---|---|
| Previous Owner | Krantz Mark | $260,200 | |
| Previous Owner | Boyle Jack C | $131,391 |
Source: Public Records
Tax History
| Year | Tax Paid | Tax Assessment Tax Assessment Total Assessment is a certain percentage of the fair market value that is determined by local assessors to be the total taxable value of land and additions on the property. | Land | Improvement |
|---|---|---|---|---|
| 2025 | $3,027 | $264,000 | $164,114 | $99,886 |
| 2024 | $2,952 | $264,551 | $147,692 | $116,859 |
| 2023 | $2,720 | $443,000 | $242,023 | $200,977 |
| 2022 | $2,846 | $257,400 | $122,257 | $135,143 |
| 2021 | $2,538 | $356,000 | $186,813 | $169,187 |
| 2020 | $2,204 | $307,000 | $182,381 | $124,619 |
| 2019 | $2,207 | $303,000 | $182,546 | $120,454 |
| 2018 | $2,035 | $276,000 | $169,371 | $106,629 |
| 2016 | $1,813 | $130,295 | $56,945 | $73,350 |
| 2015 | $1,765 | $120,450 | $56,945 | $63,505 |
| 2014 | $1,613 | $112,599 | $56,837 | $55,762 |
| 2013 | -- | $111,414 | $44,204 | $67,210 |
Source: Public Records
Map
Nearby Homes
- 179 Peachtree Dr
- 127 Peachtree Dr
- 22 Peachtree Dr Unit 14
- 116 Carrington Ln
- 104 Carrington Ln
- 103 Peachtree Dr
- 203 Peachtree Dr
- 168 Peachtree Dr
- 144 Peachtree Dr
- 128 Carrington Ln
- 90 Carrington Ln
- 196 Peachtree Dr
- 118 Peachtree Dr
- 77 Peachtree Dr
- 217 Peachtree Dr
- 82 Peachtree Dr
- 212 Peachtree Dr
- 111 Carrington Ln
- 95 Carrington Ln
- 142 Carrington Ln
Your Personal Tour Guide
Ask me questions while you tour the home.