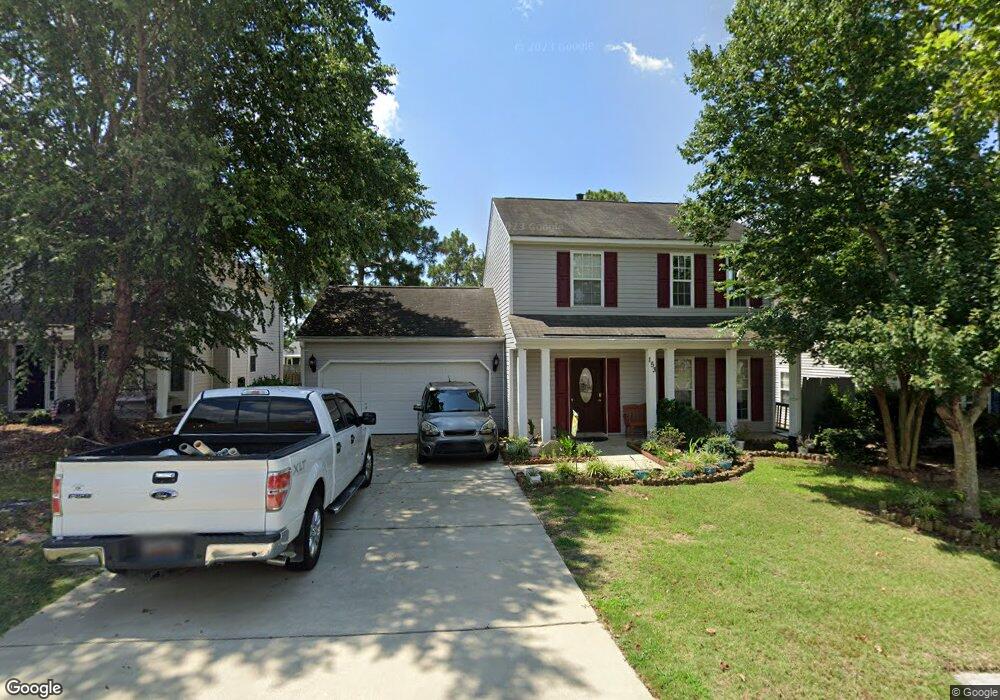
153 Riglaw Cir Lexington, SC 29073
Edmund NeighborhoodEstimated Value: $229,646 - $237,000
3
Beds
3
Baths
1,500
Sq Ft
$156/Sq Ft
Est. Value
About This Home
This home is located at 153 Riglaw Cir, Lexington, SC 29073 and is currently estimated at $234,162, approximately $156 per square foot. 153 Riglaw Cir is a home located in Lexington County with nearby schools including Carolina Springs Elementary School, Carolina Springs Middle School, and White Knoll High School.
Ownership History
Date
Name
Owned For
Owner Type
Purchase Details
Closed on
Jul 29, 2009
Sold by
Federal National Mortgage Association
Bought by
Roberds Gregory W and Roberds Angela M
Current Estimated Value
Home Financials for this Owner
Home Financials are based on the most recent Mortgage that was taken out on this home.
Original Mortgage
$120,870
Outstanding Balance
$79,009
Interest Rate
5.26%
Mortgage Type
New Conventional
Estimated Equity
$155,153
Purchase Details
Closed on
Nov 24, 2008
Sold by
Summerall E Kenneth and Summerall Anna M
Bought by
Federal National Mortgage Association
Purchase Details
Closed on
Jan 31, 2005
Sold by
D R Horton Inc
Bought by
Summerall E Kenneth and Summerall Anna M
Home Financials for this Owner
Home Financials are based on the most recent Mortgage that was taken out on this home.
Original Mortgage
$115,951
Interest Rate
5.72%
Mortgage Type
New Conventional
Purchase Details
Closed on
Oct 7, 2004
Sold by
Tidewater Development Group Llc
Bought by
D R Horton Inc
Create a Home Valuation Report for This Property
The Home Valuation Report is an in-depth analysis detailing your home's value as well as a comparison with similar homes in the area
Home Values in the Area
Average Home Value in this Area
Purchase History
| Date | Buyer | Sale Price | Title Company |
|---|---|---|---|
| Roberds Gregory W | $118,500 | -- | |
| Federal National Mortgage Association | $80,000 | -- | |
| Summerall E Kenneth | $124,193 | -- | |
| D R Horton Inc | $37,440 | -- |
Source: Public Records
Mortgage History
| Date | Status | Borrower | Loan Amount |
|---|---|---|---|
| Open | Roberds Gregory W | $120,870 | |
| Previous Owner | Summerall E Kenneth | $115,951 |
Source: Public Records
Tax History Compared to Growth
Tax History
| Year | Tax Paid | Tax Assessment Tax Assessment Total Assessment is a certain percentage of the fair market value that is determined by local assessors to be the total taxable value of land and additions on the property. | Land | Improvement |
|---|---|---|---|---|
| 2024 | $814 | $5,451 | $1,400 | $4,051 |
| 2023 | $814 | $5,451 | $1,400 | $4,051 |
| 2022 | $811 | $5,451 | $1,400 | $4,051 |
| 2020 | $832 | $5,451 | $1,400 | $4,051 |
| 2019 | $765 | $4,919 | $1,000 | $3,919 |
| 2018 | $751 | $4,919 | $1,000 | $3,919 |
| 2017 | $728 | $4,919 | $1,000 | $3,919 |
| 2016 | $722 | $4,919 | $1,000 | $3,919 |
| 2014 | $665 | $4,739 | $960 | $3,779 |
| 2013 | -- | $4,740 | $960 | $3,780 |
Source: Public Records
Map
Nearby Homes
- 278 Double Eagle Cir
- 253 Double Eagle Cir
- 104 Verano Ct
- 120 Wolf Run Ct
- 153 Double Eagle Cir
- 120 Kelberry Ct
- 129 Hillock Ct
- 226 Pico Place
- 808 Red Solstice Ct
- 243 Meadow Saffron Dr
- 409 Walking Ln
- 902 Native Rye Way
- 829 Red Solstice Ct
- 147 Meadow Saffron Dr
- 934 Native Rye Way
- 816 Ingamma Ct
- 1020 Winter Way
- 1225 White Chicory Ct
- 731 Equinox Ln
- 105 Tea Olive Ave
- 157 Riglaw Cir
- 149 Riglaw Cir
- 145 Riglaw Cir
- 161 Riglaw Cir
- 100 Mariscat Place
- 277 Double Eagle Cir
- 281 Double Eagle Cir
- 165 Riglaw Cir
- 273 Double Eagle Cir
- 301 Double Eagle Cir
- 160 Riglaw Cir
- 104 Mariscat Place
- 101 Opago Way
- 137 Riglaw Cir
- 169 Riglaw Cir
- 269 Double Eagle Cir
- 164 Riglaw Cir
- 105 Opago Way
- 173 Riglaw Cir
- 133 Riglaw Cir