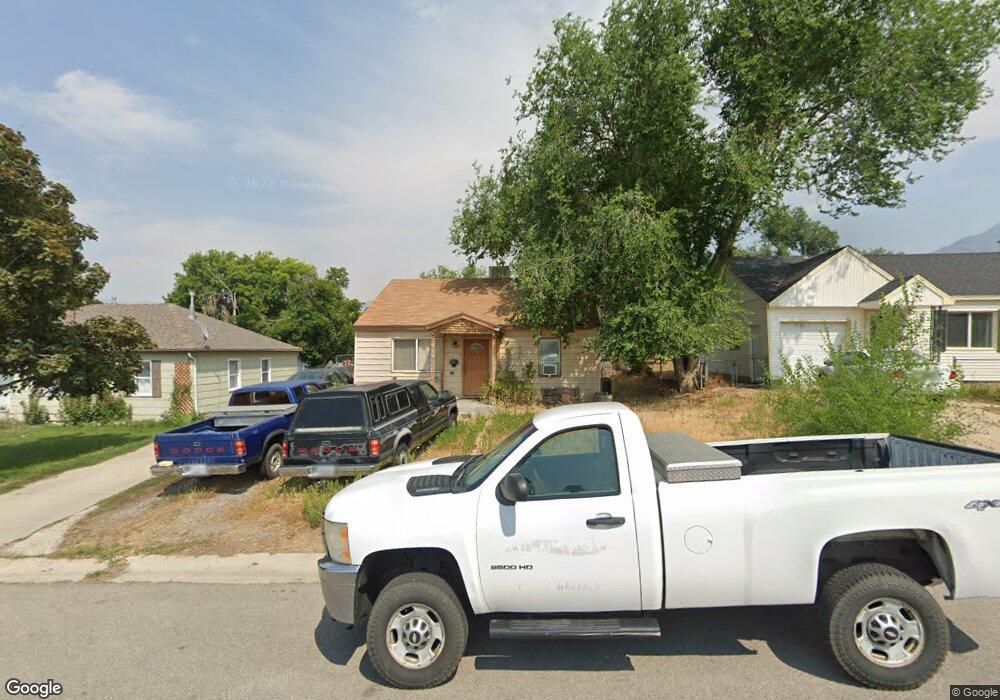
153 S 200 E Tooele, UT 84074
Estimated Value: $326,000 - $337,000
2
Beds
1
Bath
1,109
Sq Ft
$298/Sq Ft
Est. Value
About This Home
This home is located at 153 S 200 E, Tooele, UT 84074 and is currently estimated at $330,085, approximately $297 per square foot. 153 S 200 E is a home located in Tooele County with nearby schools including Sterling Elementary School, Tooele Junior High School, and Tooele High School.
Ownership History
Date
Name
Owned For
Owner Type
Purchase Details
Closed on
Sep 24, 2012
Sold by
Marshall Delbert E and Marshall Tina Lynn
Bought by
Marshall Delbert E
Current Estimated Value
Home Financials for this Owner
Home Financials are based on the most recent Mortgage that was taken out on this home.
Original Mortgage
$130,366
Interest Rate
3.75%
Mortgage Type
FHA
Purchase Details
Closed on
Aug 14, 2009
Sold by
Marshall Delbert E
Bought by
Marshall Delbert E and Marshall Tina Lynn
Home Financials for this Owner
Home Financials are based on the most recent Mortgage that was taken out on this home.
Original Mortgage
$132,451
Interest Rate
5.2%
Mortgage Type
FHA
Purchase Details
Closed on
Oct 28, 2005
Sold by
Marshall Delbert E and Marshall Tina
Bought by
Marshall Delbert E
Home Financials for this Owner
Home Financials are based on the most recent Mortgage that was taken out on this home.
Original Mortgage
$95,000
Interest Rate
8.37%
Mortgage Type
Adjustable Rate Mortgage/ARM
Create a Home Valuation Report for This Property
The Home Valuation Report is an in-depth analysis detailing your home's value as well as a comparison with similar homes in the area
Purchase History
| Date | Buyer | Sale Price | Title Company |
|---|---|---|---|
| Marshall Delbert E | -- | Cornerstone Title Insurance | |
| Marshall Delbert E | -- | Old Republic Title | |
| Marshall Delbert E | -- | Pinnacle Title |
Source: Public Records
Mortgage History
| Date | Status | Borrower | Loan Amount |
|---|---|---|---|
| Closed | Marshall Delbert E | $130,366 | |
| Closed | Marshall Delbert E | $132,451 | |
| Closed | Marshall Delbert E | $95,000 |
Source: Public Records
Tax History
| Year | Tax Paid | Tax Assessment Tax Assessment Total Assessment is a certain percentage of the fair market value that is determined by local assessors to be the total taxable value of land and additions on the property. | Land | Improvement |
|---|---|---|---|---|
| 2025 | $2,038 | $309,061 | $87,550 | $221,511 |
| 2024 | $2,292 | $174,946 | $48,153 | $126,793 |
| 2023 | $2,292 | $162,586 | $46,796 | $115,790 |
| 2022 | $1,584 | $136,253 | $55,770 | $80,483 |
| 2021 | $1,345 | $96,797 | $37,180 | $59,617 |
| 2020 | $1,184 | $147,832 | $39,438 | $108,394 |
| 2019 | $1,089 | $133,694 | $39,438 | $94,256 |
| 2018 | $1,048 | $121,962 | $40,000 | $81,962 |
| 2017 | $765 | $105,751 | $20,000 | $85,751 |
| 2016 | $635 | $52,011 | $11,000 | $41,011 |
| 2015 | $635 | $46,179 | $0 | $0 |
| 2014 | -- | $46,179 | $0 | $0 |
Source: Public Records
Map
Nearby Homes
Your Personal Tour Guide
Ask me questions while you tour the home.