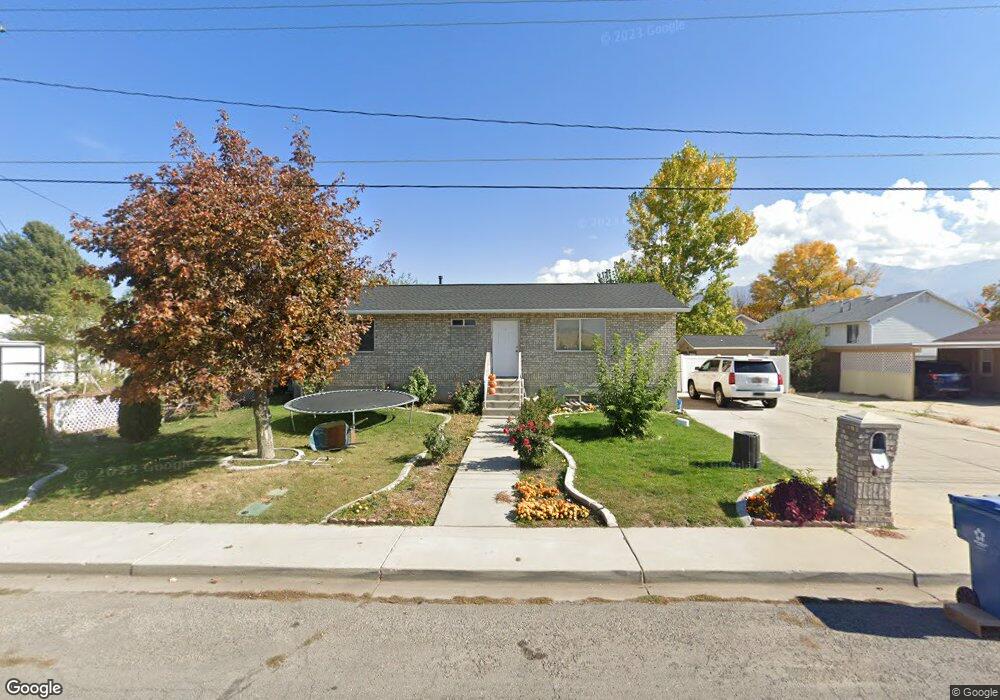
153 S 800 W Payson, UT 84651
Estimated Value: $415,530 - $476,000
4
Beds
2
Baths
1,920
Sq Ft
$227/Sq Ft
Est. Value
About This Home
This home is located at 153 S 800 W, Payson, UT 84651 and is currently estimated at $434,883, approximately $226 per square foot. 153 S 800 W is a home located in Utah County with nearby schools including Taylor Elementary School, Mt. Nebo Junior High School, and Mt. Nebo Middle.
Ownership History
Date
Name
Owned For
Owner Type
Purchase Details
Closed on
Dec 8, 2016
Sold by
Gomez Froylan
Bought by
Mejia Froylan Gomez
Current Estimated Value
Home Financials for this Owner
Home Financials are based on the most recent Mortgage that was taken out on this home.
Original Mortgage
$195,172
Interest Rate
3.75%
Mortgage Type
FHA
Purchase Details
Closed on
May 26, 2016
Sold by
Gomez Francisco J
Bought by
Gomez Froylan
Purchase Details
Closed on
May 8, 2001
Sold by
Baller Troy and Baller Heidy
Bought by
Baller Troy
Home Financials for this Owner
Home Financials are based on the most recent Mortgage that was taken out on this home.
Original Mortgage
$85,000
Interest Rate
6.89%
Create a Home Valuation Report for This Property
The Home Valuation Report is an in-depth analysis detailing your home's value as well as a comparison with similar homes in the area
Home Values in the Area
Average Home Value in this Area
Purchase History
| Date | Buyer | Sale Price | Title Company |
|---|---|---|---|
| Mejia Froylan Gomez | -- | Highland Title | |
| Gomez Froylan | -- | Highland Title | |
| Baller Troy | -- | Surety Title Agency |
Source: Public Records
Mortgage History
| Date | Status | Borrower | Loan Amount |
|---|---|---|---|
| Closed | Mejia Froylan Gomez | $195,172 | |
| Closed | Baller Troy | $85,000 |
Source: Public Records
Tax History Compared to Growth
Tax History
| Year | Tax Paid | Tax Assessment Tax Assessment Total Assessment is a certain percentage of the fair market value that is determined by local assessors to be the total taxable value of land and additions on the property. | Land | Improvement |
|---|---|---|---|---|
| 2025 | $1,939 | $214,720 | $118,200 | $272,200 |
| 2024 | $1,939 | $197,340 | $0 | $0 |
| 2023 | $1,979 | $201,960 | $0 | $0 |
| 2022 | $2,115 | $212,245 | $0 | $0 |
| 2021 | $1,753 | $282,200 | $86,900 | $195,300 |
| 2020 | $1,641 | $258,500 | $75,600 | $182,900 |
| 2019 | $1,533 | $247,500 | $65,300 | $182,200 |
| 2018 | $1,371 | $213,400 | $55,000 | $158,400 |
| 2017 | $1,252 | $104,830 | $0 | $0 |
| 2016 | $1,178 | $97,955 | $0 | $0 |
| 2015 | $1,050 | $86,735 | $0 | $0 |
| 2014 | $922 | $76,725 | $0 | $0 |
Source: Public Records
Map
Nearby Homes
- 219 S Majestic W
- 528 S 800 W
- 533 S 700 W
- 527 S 1000 W
- 610 S 800 W Unit 30
- 626 S 800 W Unit 32
- 513 W 600 S
- 310 N 1500 W
- 84 W 400 N
- 116 E 100 S
- 1836 S 100 E Unit 2
- 383 W 625 N Unit A-D
- 384 W 650 N Unit A-D
- 135 E 500 S
- 115 N 300 E
- 361 W 625 N Unit A-D
- 244 E 300 N
- 252 S 400 E
- 1323 N 1390 E Unit 26-101
- 1287 N 1390 E Unit 25-96