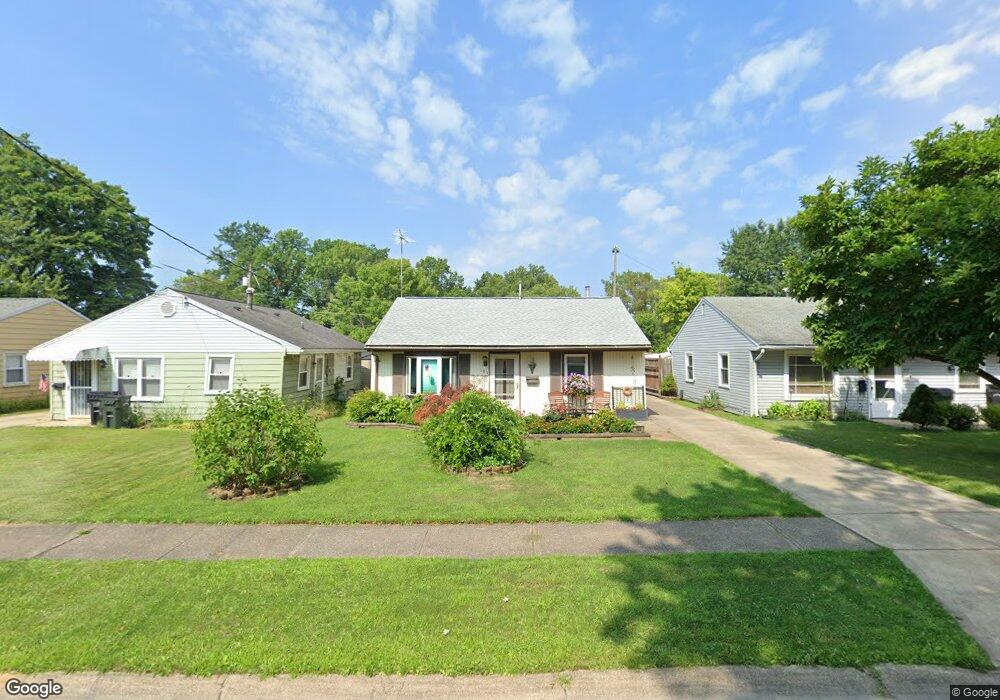
153 S Logan St Elyria, OH 44035
Estimated Value: $110,924 - $111,000
2
Beds
1
Bath
728
Sq Ft
$152/Sq Ft
Est. Value
About This Home
This home is located at 153 S Logan St, Elyria, OH 44035 and is currently estimated at $110,981, approximately $152 per square foot. 153 S Logan St is a home located in Lorain County with nearby schools including Eastern Heights Middle School, Elyria High School, and Constellation Schools: Elyria Community Elementary.
Ownership History
Date
Name
Owned For
Owner Type
Purchase Details
Closed on
Apr 28, 2003
Sold by
Lempke Ronald H
Bought by
Lempke Ronald H and Lempke Debbie
Current Estimated Value
Create a Home Valuation Report for This Property
The Home Valuation Report is an in-depth analysis detailing your home's value as well as a comparison with similar homes in the area
Home Values in the Area
Average Home Value in this Area
Purchase History
| Date | Buyer | Sale Price | Title Company |
|---|---|---|---|
| Lempke Ronald H | -- | -- |
Source: Public Records
Tax History
| Year | Tax Paid | Tax Assessment Tax Assessment Total Assessment is a certain percentage of the fair market value that is determined by local assessors to be the total taxable value of land and additions on the property. | Land | Improvement |
|---|---|---|---|---|
| 2024 | $756 | $25,781 | $6,748 | $19,033 |
| 2023 | $630 | $20,724 | $5,978 | $14,746 |
| 2022 | $650 | $20,724 | $5,978 | $14,746 |
| 2021 | $652 | $20,724 | $5,978 | $14,746 |
| 2020 | $553 | $17,790 | $5,130 | $12,660 |
| 2019 | $550 | $17,790 | $5,130 | $12,660 |
| 2018 | $551 | $17,790 | $5,130 | $12,660 |
| 2017 | $667 | $19,240 | $4,760 | $14,480 |
| 2016 | $658 | $19,240 | $4,760 | $14,480 |
| 2015 | $616 | $19,240 | $4,760 | $14,480 |
| 2014 | $609 | $19,240 | $4,760 | $14,480 |
| 2013 | $603 | $19,240 | $4,760 | $14,480 |
Source: Public Records
Map
Nearby Homes
- 171 S Logan St
- 805 Clark St
- 164 Woodbury St
- 340 Boston Ave
- 609 Princeton Ave
- 453 Kenyon Ave
- 120 Longford Ave
- 127 Beebe Ave
- 147 Bellfield Ave
- 144 Roosevelt Ave
- 800 Boston Ave
- 209 Clark St
- 355 Kenyon Ave
- 817 Boston Ave
- 347 Kenyon Ave
- 832 S Logan St
- 147 Hamilton St
- 249 Roosevelt Ave
- 746 Delaware Ave
- 235 Brandtson Ave
Your Personal Tour Guide
Ask me questions while you tour the home.