Estimated Value: $147,000 - $217,000
3
Beds
1
Bath
912
Sq Ft
$184/Sq Ft
Est. Value
About This Home
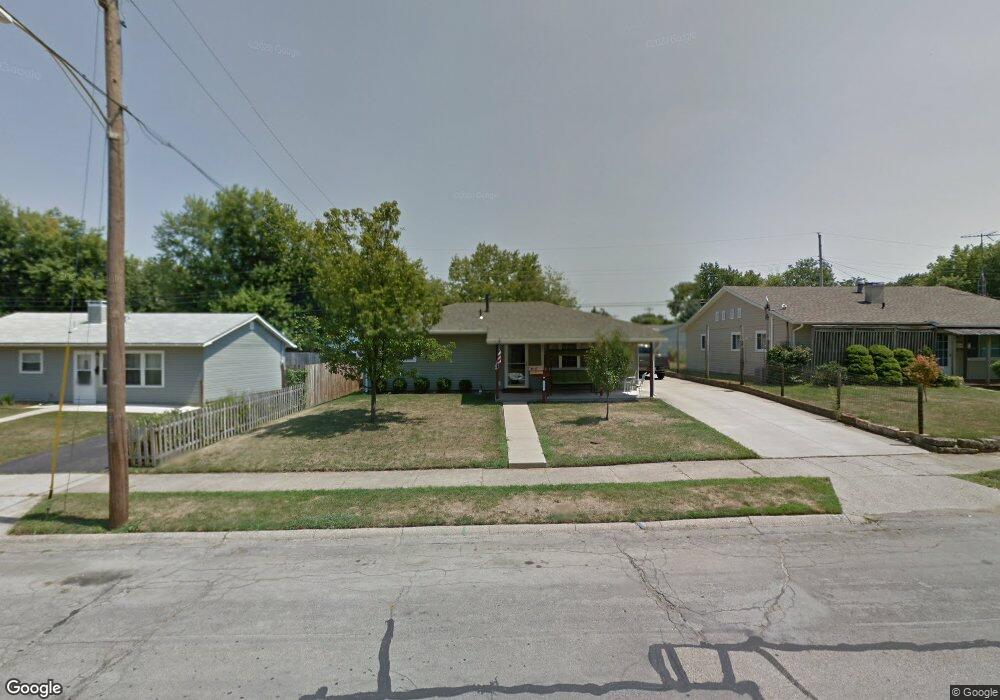
This home is located at 153 Sheelin Rd, Xenia, OH 45385 and is currently estimated at $167,842, approximately $184 per square foot. 153 Sheelin Rd is a home located in Greene County with nearby schools including Xenia High School, Summit Academy Community School for Alternative Learners - Xenia, and Legacy Christian Academy.
Ownership History
Date
Name
Owned For
Owner Type
Purchase Details
Closed on
Feb 7, 2017
Bought by
Us Bank Trust Na Trustee
Current Estimated Value
Home Financials for this Owner
Home Financials are based on the most recent Mortgage that was taken out on this home.
Interest Rate
4.19%
Purchase Details
Closed on
Feb 6, 2017
Sold by
L S F 9 Master Participat
Bought by
Kimike Properties Llc
Home Financials for this Owner
Home Financials are based on the most recent Mortgage that was taken out on this home.
Interest Rate
4.19%
Purchase Details
Closed on
Mar 2, 1994
Bought by
Merz John R and Merz Merz
Create a Home Valuation Report for This Property
The Home Valuation Report is an in-depth analysis detailing your home's value as well as a comparison with similar homes in the area
Home Values in the Area
Average Home Value in this Area
Purchase History
| Date | Buyer | Sale Price | Title Company |
|---|---|---|---|
| Us Bank Trust Na Trustee | $54,000 | -- | |
| Kimike Properties Llc | $57,500 | None Available | |
| Merz John R | $57,000 | -- |
Source: Public Records
Mortgage History
| Date | Status | Borrower | Loan Amount |
|---|---|---|---|
| Closed | Us Bank Trust Na Trustee | -- | |
| Open | Kimike Properties Llc | $75,000 |
Source: Public Records
Tax History Compared to Growth
Tax History
| Year | Tax Paid | Tax Assessment Tax Assessment Total Assessment is a certain percentage of the fair market value that is determined by local assessors to be the total taxable value of land and additions on the property. | Land | Improvement |
|---|---|---|---|---|
| 2024 | $1,531 | $35,790 | $8,020 | $27,770 |
| 2023 | $1,531 | $35,790 | $8,020 | $27,770 |
| 2022 | $1,266 | $25,230 | $5,730 | $19,500 |
| 2021 | $1,283 | $25,230 | $5,730 | $19,500 |
| 2020 | $1,229 | $25,230 | $5,730 | $19,500 |
| 2019 | $1,126 | $21,760 | $4,250 | $17,510 |
| 2018 | $1,130 | $21,740 | $4,250 | $17,490 |
| 2017 | $1,455 | $21,740 | $4,250 | $17,490 |
| 2016 | $1,455 | $20,390 | $4,250 | $16,140 |
| 2015 | $1,054 | $20,390 | $4,250 | $16,140 |
| 2014 | $1,008 | $20,390 | $4,250 | $16,140 |
Source: Public Records
Map
Nearby Homes
- 343 Sheelin Rd
- 1223 June Dr
- 1233 June Dr
- 1283 June Dr
- 1391 June Dr
- 1351 Omard Dr
- 1342 Kylemore Dr
- 912 Omard Dr
- 883 Omard Dr
- 509 Antrim Rd
- 1144 Rockwell Dr
- 305-325 Bellbrook Ave
- 121 S Progress Dr
- 613 N West St
- 453 Walnut St
- 1568 Cheyenne Dr
- 0 W Church St
- 137 Pleasant St
- 516 N King St
- 1208 Bellbrook Ave
- 167 Sheelin Rd
- 141 Sheelin Rd
- 1203 Frost Circle Dr
- 1217 Frost Circle Dr
- 179 Sheelin Rd
- 129 Sheelin Rd
- 1191 Frost Circle Dr
- 1231 Frost Circle Dr
- 150 Sheelin Rd
- 162 Sheelin Rd
- 1181 Frost Circle Dr
- 191 Sheelin Rd
- 115 Sheelin Rd
- 1181 Frost Cir
- 138 Sheelin Rd
- 174 Sheelin Rd
- 1239 Frost Circle Dr
- 124 Sheelin Rd
- 205 Sheelin Rd
- 1173 Frost Circle Dr