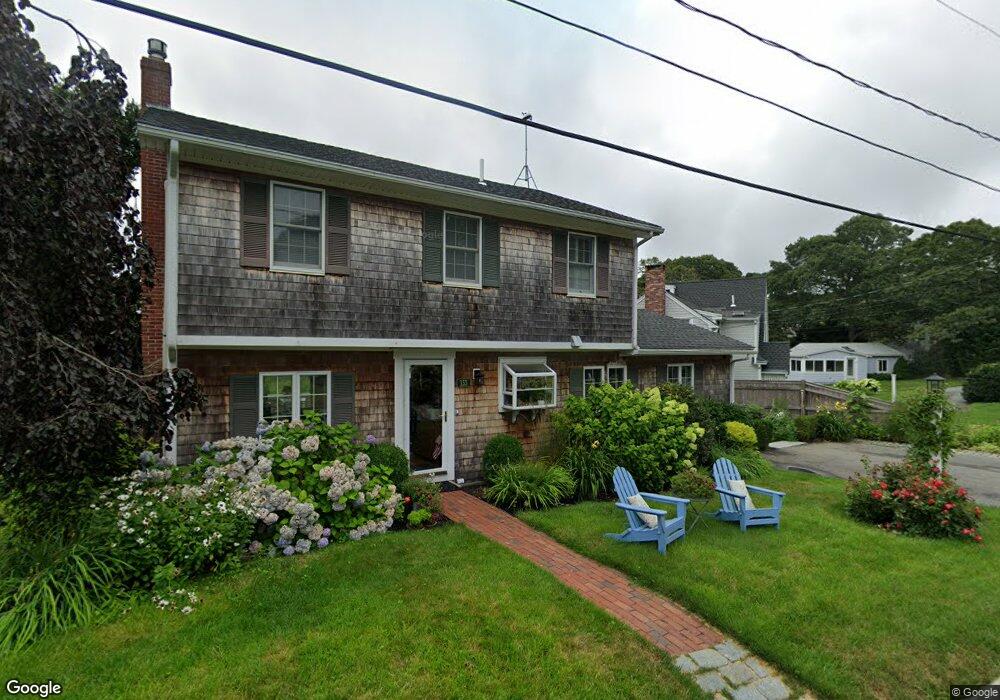
153 Tahanto Rd Pocasset, MA 02559
Estimated Value: $823,000 - $989,000
3
Beds
2
Baths
1,776
Sq Ft
$520/Sq Ft
Est. Value
About This Home
This home is located at 153 Tahanto Rd, Pocasset, MA 02559 and is currently estimated at $923,443, approximately $519 per square foot. 153 Tahanto Rd is a home located in Barnstable County with nearby schools including Bourne High School, Cadence Academy Preschool - Bourne, and St Margaret Regional School.
Ownership History
Date
Name
Owned For
Owner Type
Purchase Details
Closed on
Jan 15, 2015
Sold by
Betty&Raymond Rt and Wylie Thomas R
Bought by
Wylie Thomas R and Wylie Delian D
Current Estimated Value
Purchase Details
Closed on
Feb 6, 2008
Sold by
Raymond F Wylie T F and Raymond Wylie
Bought by
Betty & Raymond Rt and Wylie
Create a Home Valuation Report for This Property
The Home Valuation Report is an in-depth analysis detailing your home's value as well as a comparison with similar homes in the area
Home Values in the Area
Average Home Value in this Area
Purchase History
| Date | Buyer | Sale Price | Title Company |
|---|---|---|---|
| Wylie Thomas R | -- | -- | |
| Wylie Thomas R | -- | -- | |
| Betty & Raymond Rt | $10,000 | -- | |
| Betty & Raymond Rt | $10,000 | -- |
Source: Public Records
Mortgage History
| Date | Status | Borrower | Loan Amount |
|---|---|---|---|
| Previous Owner | Betty & Raymond Rt | $100,000 | |
| Previous Owner | Betty & Raymond Rt | $60,000 |
Source: Public Records
Tax History Compared to Growth
Tax History
| Year | Tax Paid | Tax Assessment Tax Assessment Total Assessment is a certain percentage of the fair market value that is determined by local assessors to be the total taxable value of land and additions on the property. | Land | Improvement |
|---|---|---|---|---|
| 2025 | $6,446 | $825,300 | $506,200 | $319,100 |
| 2024 | $6,303 | $785,900 | $482,100 | $303,800 |
| 2023 | $6,127 | $695,500 | $426,600 | $268,900 |
| 2022 | $5,868 | $581,600 | $377,600 | $204,000 |
| 2021 | $2,290 | $529,300 | $343,600 | $185,700 |
| 2020 | $2,095 | $518,000 | $340,300 | $177,700 |
| 2019 | $2,132 | $507,900 | $340,300 | $167,600 |
| 2018 | $5,100 | $483,900 | $324,200 | $159,700 |
| 2017 | $4,936 | $479,200 | $321,100 | $158,100 |
| 2016 | $4,793 | $471,800 | $321,100 | $150,700 |
| 2015 | $4,497 | $446,600 | $299,700 | $146,900 |
Source: Public Records
Map
Nearby Homes