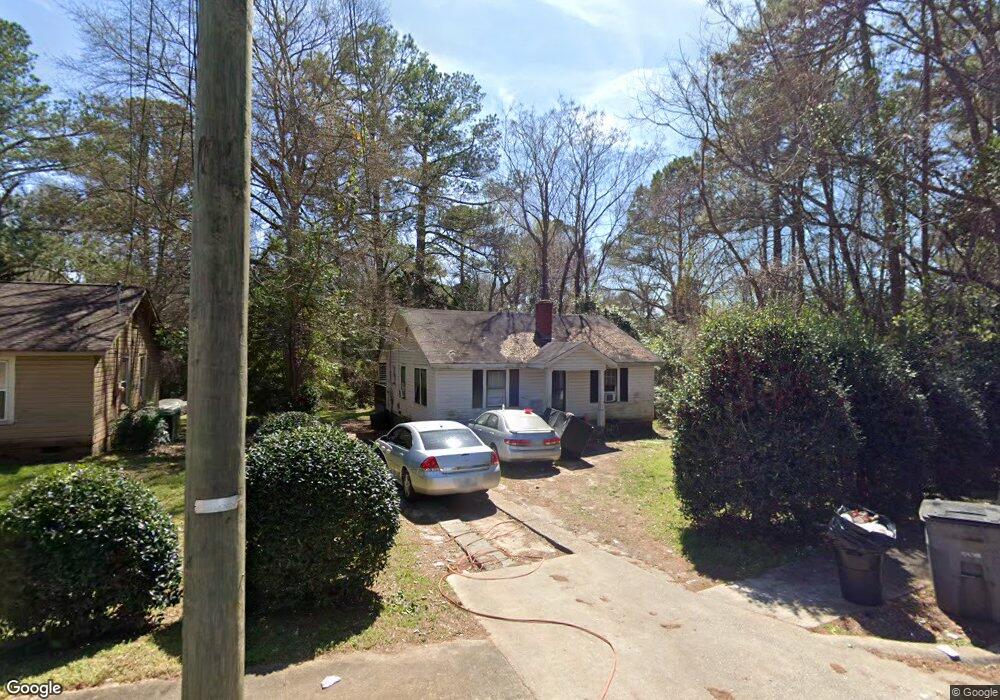
153 Turner St Lagrange, GA 30240
Estimated Value: $68,000 - $158,000
3
Beds
1
Bath
1,064
Sq Ft
$117/Sq Ft
Est. Value
About This Home
This home is located at 153 Turner St, Lagrange, GA 30240 and is currently estimated at $123,958, approximately $116 per square foot. 153 Turner St is a home located in Troup County with nearby schools including Franklin Forest Elementary School, Hollis Hand Elementary School, and Ethel W. Kight Elementary School.
Ownership History
Date
Name
Owned For
Owner Type
Purchase Details
Closed on
Jun 6, 2003
Sold by
William Titman E
Bought by
Alford Peter T
Current Estimated Value
Purchase Details
Closed on
Apr 27, 2001
Sold by
Raymond Marie
Bought by
William Titman E
Purchase Details
Closed on
Apr 20, 2001
Sold by
Erris J Dowell
Bought by
Raymond Marie
Purchase Details
Closed on
Jul 1, 1996
Sold by
Randy Cofield
Bought by
Erris J Dowell
Purchase Details
Closed on
Nov 2, 1993
Sold by
Daniel K
Bought by
Randy Cofield
Purchase Details
Closed on
Nov 1, 1993
Sold by
Arrington C
Bought by
Daniel K
Purchase Details
Closed on
Feb 11, 1984
Sold by
Bertlshofer John C
Bought by
Arrington C
Purchase Details
Closed on
Dec 1, 1981
Sold by
Mary A Bertlshofer
Bought by
Bertlshofer John C
Purchase Details
Closed on
Jul 20, 1979
Sold by
Scr Realty
Bought by
Mary A Bertlshofer
Purchase Details
Closed on
Jan 1, 1970
Sold by
James W Harris
Bought by
Scr Realty
Create a Home Valuation Report for This Property
The Home Valuation Report is an in-depth analysis detailing your home's value as well as a comparison with similar homes in the area
Purchase History
| Date | Buyer | Sale Price | Title Company |
|---|---|---|---|
| Alford Peter T | $172,500 | -- | |
| William Titman E | -- | -- | |
| Raymond Marie | $22,000 | -- | |
| Erris J Dowell | $36,000 | -- | |
| Randy Cofield | $55,000 | -- | |
| Daniel K | -- | -- | |
| Arrington C | $65,000 | -- | |
| Bertlshofer John C | -- | -- | |
| Mary A Bertlshofer | -- | -- | |
| Scr Realty | -- | -- |
Source: Public Records
Tax History
| Year | Tax Paid | Tax Assessment Tax Assessment Total Assessment is a certain percentage of the fair market value that is determined by local assessors to be the total taxable value of land and additions on the property. | Land | Improvement |
|---|---|---|---|---|
| 2025 | $655 | $24,000 | $2,920 | $21,080 |
| 2024 | $611 | $22,400 | $2,920 | $19,480 |
| 2023 | $500 | $18,320 | $2,920 | $15,400 |
| 2022 | $489 | $17,520 | $2,920 | $14,600 |
| 2021 | $436 | $14,440 | $2,920 | $11,520 |
| 2020 | $436 | $14,440 | $2,920 | $11,520 |
| 2019 | $399 | $13,240 | $2,520 | $10,720 |
| 2018 | $399 | $13,240 | $2,520 | $10,720 |
| 2017 | $399 | $13,240 | $2,520 | $10,720 |
| 2016 | $396 | $13,114 | $2,520 | $10,594 |
| 2015 | $407 | $13,466 | $2,872 | $10,594 |
| 2014 | $386 | $12,753 | $2,872 | $9,881 |
| 2013 | -- | $13,610 | $2,872 | $10,738 |
Source: Public Records
Map
Nearby Homes
- 106 Ewing St
- 724 Camellia Dr
- 222 Beechwood Cir
- 732 Camellia Dr
- 109 Thomas St
- 900 North St
- 110 Russell St
- 204 Colonial St
- 219 Banks St
- 201 S Chilton Crescent
- 203 S Chilton Crescent
- 806 New Franklin Rd
- 202 Park Hill Dr
- 705 Piney Woods Dr
- 120 Saynor Cir
- 114 Briarcliff Rd
- 102 Beech Creek Dr
- 0 Ridley Ave Unit 10550104
- 105 Saynor Cir
- 102 Dogwood Dr
- 151 Turner St
- 708 Camellia Dr
- 147 Turner St
- 710 Camellia Dr
- 145 Turner St
- 706 Camellia Dr
- 149 Turner St
- 149 Turner St
- 712 Camellia Dr
- 143 Turner St
- 141 Turner St
- 704 Camellia Dr
- 139 Turner St
- 714 Camellia Dr Unit 202
- 714 Camellia Dr
- 137 Turner St
- 705 Camellia Dr
- 707 Camellia Dr
- 703 Camellia Dr
- 702 Camellia Dr
Your Personal Tour Guide
Ask me questions while you tour the home.