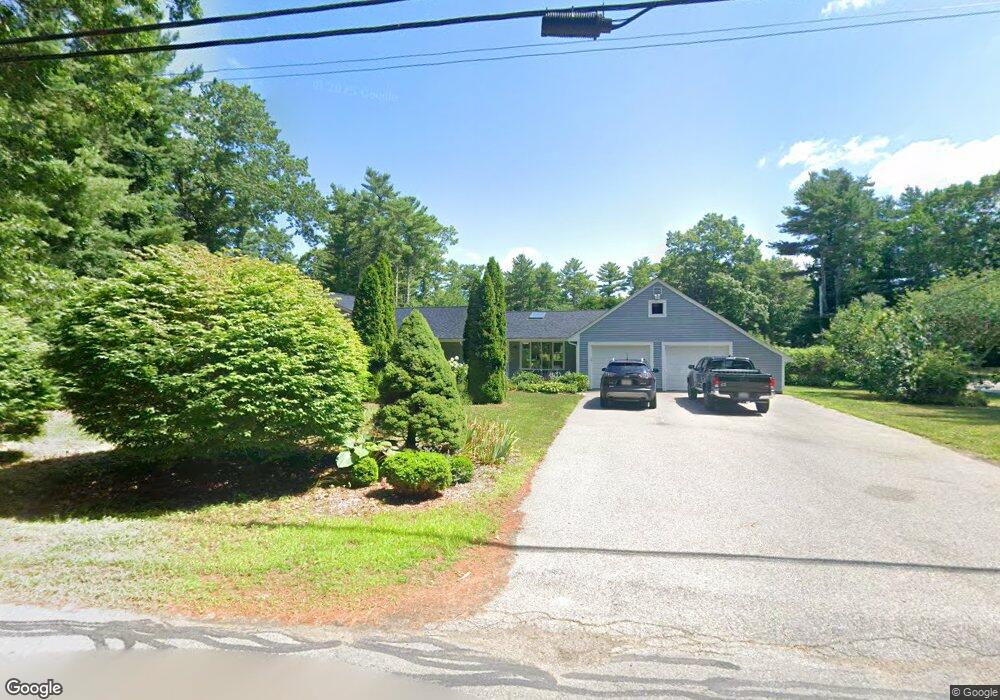
153 Union Bridge Rd Duxbury, MA 02332
Estimated Value: $766,000 - $852,000
3
Beds
3
Baths
1,507
Sq Ft
$534/Sq Ft
Est. Value
About This Home
This home is located at 153 Union Bridge Rd, Duxbury, MA 02332 and is currently estimated at $804,604, approximately $533 per square foot. 153 Union Bridge Rd is a home located in Plymouth County with nearby schools including Chandler Elementary School, Alden School, and Duxbury Middle School.
Ownership History
Date
Name
Owned For
Owner Type
Purchase Details
Closed on
Feb 20, 2025
Sold by
James & Jeanne Lt and Chappuis
Bought by
Donovan David C and Donovan Briana
Current Estimated Value
Home Financials for this Owner
Home Financials are based on the most recent Mortgage that was taken out on this home.
Original Mortgage
$736,415
Outstanding Balance
$732,056
Interest Rate
6.93%
Mortgage Type
FHA
Estimated Equity
$72,548
Purchase Details
Closed on
Jan 14, 2021
Sold by
Chappuis James M and Chappuis Jeanne M
Bought by
James & Jeanne Lt
Purchase Details
Closed on
May 6, 1996
Sold by
Bray Lawrence and Bray Joanne F
Bought by
Chappuis James M and Chappuis Jenane M
Create a Home Valuation Report for This Property
The Home Valuation Report is an in-depth analysis detailing your home's value as well as a comparison with similar homes in the area
Home Values in the Area
Average Home Value in this Area
Purchase History
| Date | Buyer | Sale Price | Title Company |
|---|---|---|---|
| Donovan David C | $750,000 | None Available | |
| Donovan David C | $750,000 | None Available | |
| James & Jeanne Lt | -- | None Available | |
| James & Jeanne Lt | -- | None Available | |
| Chappuis James M | $183,000 | -- | |
| Chappuis James M | $183,000 | -- |
Source: Public Records
Mortgage History
| Date | Status | Borrower | Loan Amount |
|---|---|---|---|
| Open | Donovan David C | $736,415 | |
| Closed | Donovan David C | $736,415 | |
| Previous Owner | Chappuis James M | $140,000 | |
| Previous Owner | Chappuis James M | $150,000 |
Source: Public Records
Tax History Compared to Growth
Tax History
| Year | Tax Paid | Tax Assessment Tax Assessment Total Assessment is a certain percentage of the fair market value that is determined by local assessors to be the total taxable value of land and additions on the property. | Land | Improvement |
|---|---|---|---|---|
| 2025 | $7,632 | $752,700 | $352,100 | $400,600 |
| 2024 | $7,157 | $711,400 | $352,100 | $359,300 |
| 2023 | $6,999 | $654,700 | $366,200 | $288,500 |
| 2022 | $7,240 | $563,900 | $301,800 | $262,100 |
| 2021 | $6,819 | $470,900 | $252,000 | $218,900 |
| 2020 | $6,795 | $463,500 | $254,000 | $209,500 |
| 2019 | $6,221 | $423,800 | $211,700 | $212,100 |
| 2018 | $6,049 | $399,000 | $196,800 | $202,200 |
| 2017 | $5,711 | $368,200 | $183,900 | $184,300 |
| 2016 | $5,726 | $368,200 | $183,900 | $184,300 |
| 2015 | $5,449 | $349,300 | $160,500 | $188,800 |
Source: Public Records
Map
Nearby Homes
- 45 Elis Ln
- 346 Summer St
- 600 Summer St Unit 7
- 600 Summer St Unit 6
- 18 King Phillips Path
- 131 East St
- 0 East St
- 16 Fieldstone Farm Way
- 110 Keene St
- 15 Fieldstone Farm Way Unit 8
- 45 Summer St
- 26 Winter St
- 202 Birch St
- 0 Kingstown Way
- 17 Trout Farm Ln
- 61 Chapel St
- 64 Trout Farm Ln
- 90 Autumn Ave
- 249 High St
- 42 Trout Farm Ln Unit 2