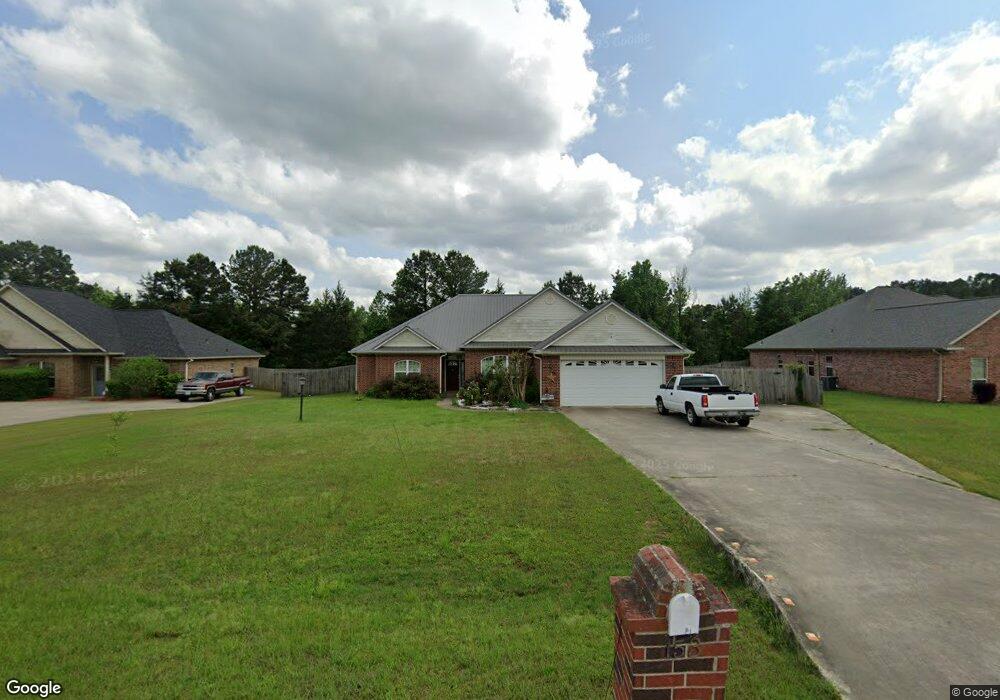
153 W Starlite Dr Texarkana, TX 75501
Estimated Value: $306,305 - $355,000
--
Bed
--
Bath
2,352
Sq Ft
$142/Sq Ft
Est. Value
About This Home
This home is located at 153 W Starlite Dr, Texarkana, TX 75501 and is currently estimated at $334,326, approximately $142 per square foot. 153 W Starlite Dr is a home located in Bowie County with nearby schools including Liberty-Eylau Early Childhood Center, Liberty-Eylau Primary School, and Liberty-Eylau C.K. Bender Elementary Campus.
Ownership History
Date
Name
Owned For
Owner Type
Purchase Details
Closed on
Mar 26, 2015
Sold by
Christina Trust
Bought by
Provence Randall and Provence Rose
Current Estimated Value
Home Financials for this Owner
Home Financials are based on the most recent Mortgage that was taken out on this home.
Original Mortgage
$136,800
Outstanding Balance
$105,543
Interest Rate
3.88%
Mortgage Type
New Conventional
Estimated Equity
$228,783
Purchase Details
Closed on
Sep 2, 2014
Sold by
Shults Robby J and Shults Sasha D
Bought by
Christiana Trust
Purchase Details
Closed on
Feb 24, 2009
Sold by
Cbsc Inc
Bought by
Shults Robby J and Shults Sasha D
Home Financials for this Owner
Home Financials are based on the most recent Mortgage that was taken out on this home.
Original Mortgage
$201,103
Interest Rate
4.92%
Mortgage Type
FHA
Create a Home Valuation Report for This Property
The Home Valuation Report is an in-depth analysis detailing your home's value as well as a comparison with similar homes in the area
Home Values in the Area
Average Home Value in this Area
Purchase History
| Date | Buyer | Sale Price | Title Company |
|---|---|---|---|
| Provence Randall | -- | None Available | |
| Provence Randall | $136,800 | Title 365 Lewisville | |
| Christiana Trust | $180,050 | None Available | |
| Shults Robby J | -- | None Available |
Source: Public Records
Mortgage History
| Date | Status | Borrower | Loan Amount |
|---|---|---|---|
| Open | Provence Randall | $136,800 | |
| Closed | Provence Randall | $136,800 | |
| Previous Owner | Shults Robby J | $201,103 |
Source: Public Records
Tax History Compared to Growth
Tax History
| Year | Tax Paid | Tax Assessment Tax Assessment Total Assessment is a certain percentage of the fair market value that is determined by local assessors to be the total taxable value of land and additions on the property. | Land | Improvement |
|---|---|---|---|---|
| 2025 | $3,381 | $342,362 | -- | -- |
| 2024 | $3,381 | $310,438 | $21,500 | $328,384 |
| 2023 | $4,217 | $282,216 | $0 | $0 |
| 2022 | $4,421 | $300,448 | $21,500 | $278,948 |
| 2021 | $4,273 | $233,236 | $20,000 | $213,236 |
| 2020 | $4,128 | $223,668 | $20,000 | $203,668 |
| 2019 | $4,168 | $214,572 | $20,000 | $194,572 |
| 2018 | $4,032 | $207,562 | $20,000 | $187,562 |
| 2017 | $4,029 | $208,228 | $20,000 | $188,228 |
| 2016 | $4,029 | $208,228 | $20,000 | $188,228 |
| 2015 | $3,883 | $214,615 | $20,000 | $194,615 |
| 2014 | $3,883 | $207,642 | $20,000 | $187,642 |
Source: Public Records
Map
Nearby Homes
- 194 W Starlite Dr
- 280 Patriot Way
- 6 Southridge St
- 101 Redwood Dr
- 6514 Buchanan Loop Rd
- 403 Brookfield St
- 7689 Us-59
- 7685 State Highway 59
- 144 Joe Tyl Rd
- 6606 Us-59
- 6606 Us Highway 59 S
- 6815 Buchanan Loop Rd
- 2043 Randall Rd
- 206 Fm 3244
- lot15 B2 Quail Brook
- lot15 B1 Quail Brook
- lot14 B2 Quail Brook
- Lot 1 B2 Quail Brook
- 39 Quail Brook Dr
- 0 Randall Rd
- 131 W Starlite Dr
- 175 W Starlite Dr
- 319 W Starlite Dr
- 0 W Starlite Dr
- 115 W Starlite Dr
- 197 W Starlite Dr
- 150 W Starlite Dr
- 101 W Starlite Dr
- 219 W Starlite Dr
- 126 W Starlite Dr
- 172 W Starlite Dr
- 118 W Starlite Dr
- 237 W Starlite Dr
- 104 W Starlite Dr
- 214 W Starlite Dr
- W Starlite
- 6059 Buchanan Loop Rd
- 175 Patriot Way
- 195 Patriot Way
- 215 Patriot Way