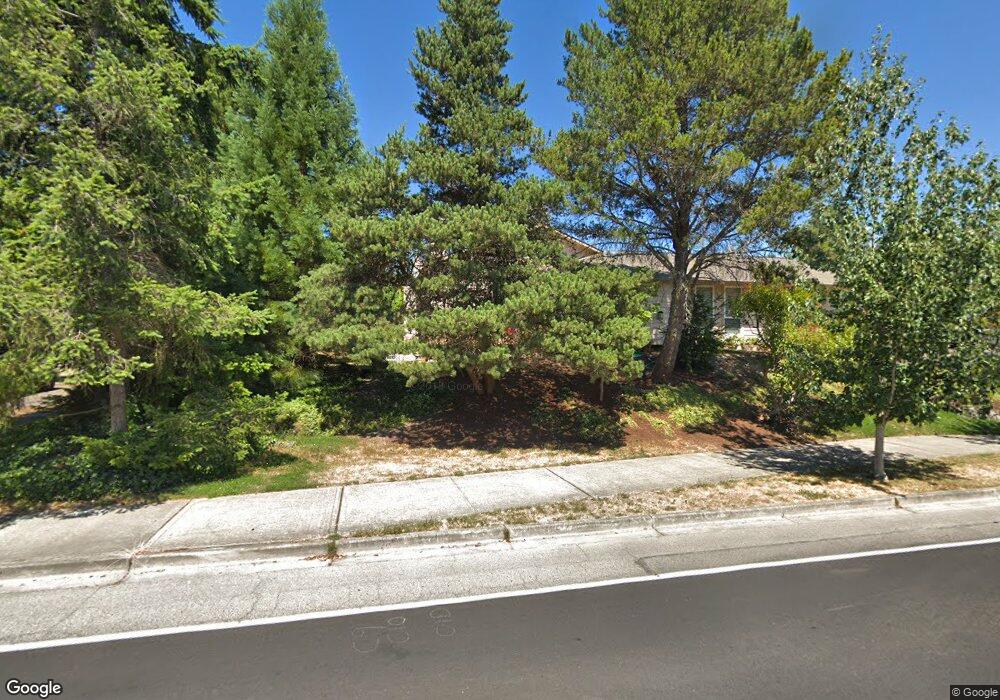
153 Wallace Way NE Unit 4 Bainbridge Island, WA 98110
Estimated Value: $478,971 - $563,000
2
Beds
2
Baths
1,053
Sq Ft
$510/Sq Ft
Est. Value
About This Home
This home is located at 153 Wallace Way NE Unit 4, Bainbridge Island, WA 98110 and is currently estimated at $537,243, approximately $510 per square foot. 153 Wallace Way NE Unit 4 is a home located in Kitsap County with nearby schools including Bainbridge High School, St. Cecilia Catholic School, and Madrona School.
Ownership History
Date
Name
Owned For
Owner Type
Purchase Details
Closed on
May 30, 2024
Sold by
Bleedorn Gary Thomas
Bought by
Bleedorn Jocelyn R
Current Estimated Value
Purchase Details
Closed on
Feb 20, 2003
Sold by
Wintergerst Enrique
Bought by
Bleedorn Gary T
Home Financials for this Owner
Home Financials are based on the most recent Mortgage that was taken out on this home.
Original Mortgage
$100,000
Interest Rate
5.93%
Mortgage Type
Unknown
Purchase Details
Closed on
Oct 13, 1998
Sold by
Henderson James and Henderson Shelagh D
Bought by
Wintergerst Enrique
Home Financials for this Owner
Home Financials are based on the most recent Mortgage that was taken out on this home.
Original Mortgage
$84,000
Interest Rate
6.79%
Purchase Details
Closed on
May 21, 1998
Sold by
Henderson James and Henderson Shelagh D
Bought by
Henderson James and Henderson Shelagh D
Create a Home Valuation Report for This Property
The Home Valuation Report is an in-depth analysis detailing your home's value as well as a comparison with similar homes in the area
Home Values in the Area
Average Home Value in this Area
Purchase History
| Date | Buyer | Sale Price | Title Company |
|---|---|---|---|
| Bleedorn Jocelyn R | $313 | None Listed On Document | |
| Bleedorn Gary T | $149,500 | Pacific Nw Title | |
| Wintergerst Enrique | $105,000 | Transnation Title Insurance | |
| Henderson James | -- | -- |
Source: Public Records
Mortgage History
| Date | Status | Borrower | Loan Amount |
|---|---|---|---|
| Previous Owner | Bleedorn Gary T | $100,000 | |
| Previous Owner | Wintergerst Enrique | $84,000 |
Source: Public Records
Tax History Compared to Growth
Tax History
| Year | Tax Paid | Tax Assessment Tax Assessment Total Assessment is a certain percentage of the fair market value that is determined by local assessors to be the total taxable value of land and additions on the property. | Land | Improvement |
|---|---|---|---|---|
| 2026 | $3,533 | $417,280 | -- | $417,280 |
| 2025 | $3,533 | $417,280 | -- | $417,280 |
| 2024 | $3,378 | $397,410 | -- | $397,410 |
| 2023 | $3,356 | $397,410 | $0 | $397,410 |
| 2022 | $3,547 | $361,280 | $0 | $361,280 |
| 2021 | $3,536 | $344,080 | $0 | $344,080 |
| 2020 | $3,140 | $299,200 | $0 | $299,200 |
| 2019 | $3,007 | $291,900 | $0 | $291,900 |
| 2018 | $2,815 | $173,750 | $0 | $173,750 |
| 2017 | $1,937 | $173,750 | $0 | $173,750 |
| 2016 | $2,053 | $177,460 | $0 | $177,460 |
| 2015 | $2,013 | $177,460 | $0 | $177,460 |
| 2014 | -- | $177,460 | $0 | $177,460 |
| 2013 | -- | $177,460 | $0 | $177,460 |
Source: Public Records
Map
Nearby Homes
- 171 Wallace Way NE Unit B
- 774 Madison Ave N Unit B774
- 300 High School Rd NE Unit 203
- 300 High School Rd NE Unit 419
- 620 NE Vineyard Ln Unit B302
- 752 NE Vineyard Ln Unit L205
- 610 NE Vineyard Ln Unit A104
- 392 Wills Ln NW
- 522 Madrona Way NE Unit 4
- 224 Canopy Path NW
- 200 Shepard Way NW
- 230 Canopy Path NW
- 204 Shepard Way NW
- 214 Shepard Way NW
- 1322 Polly's Ln
- 259 Shepard Way NW Unit 204
- 1351 Nolta Loop NE
- 1349 Nolta Loop NE
- 144 Hall Brothers Loop NW Unit 101
- 1240 Weaver Rd NW Unit B1
- 151 Wallace Way NE Unit 2
- 149 Wallace Way NE
- 155 Wallace Way NE Unit 5
- 157 Wallace Way NE Unit 3
- 159 Wallace Way NE Unit 6
- 971 Blue Heron Ave NE
- 189 Wallace Way NE Unit 189A
- 189 Wallace Way NE Unit B
- 171A Wallace Way NE Unit 1
- 969 Blue Heron Ave NE Unit 3
- 967 Blue Heron Ave NE
- 931 Blue Heron Ave NE Unit 4
- 927 Blue Heron Ave NE
- 929 Blue Heron Ave NE Unit 3
- 925 Blue Heron Ave NE
- 1007 Blue Heron Ave NE Unit 2
- 1009 Blue Heron Ave NE
- 1005 Blue Heron Ave NE Unit 1
- 1005 Blue Heron Ave NE Unit 2