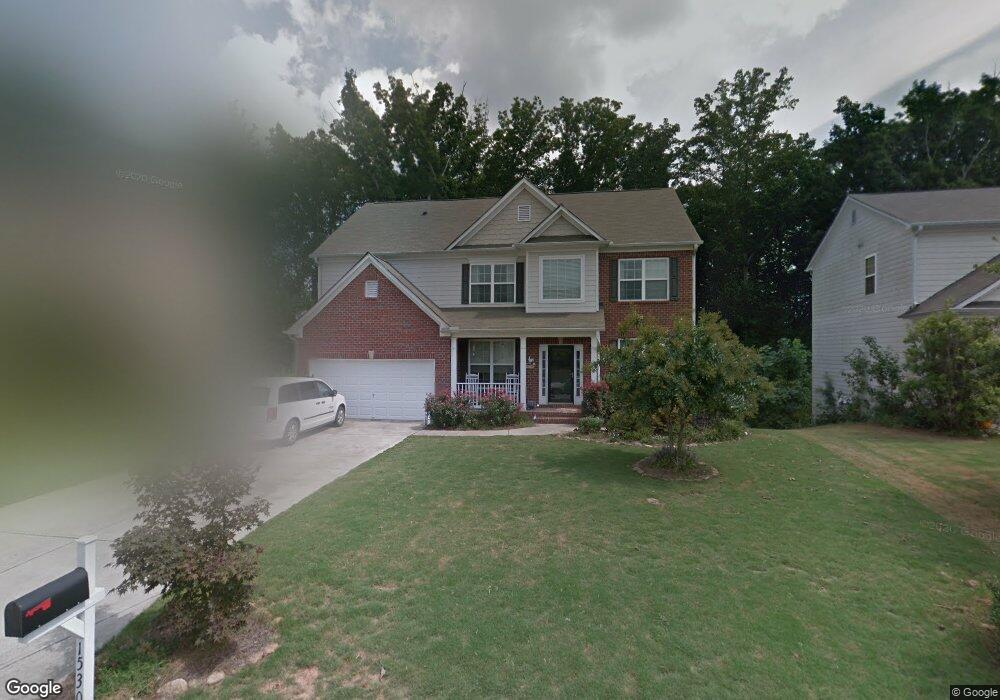
1530 Hidden Creek Point Cumming, GA 30040
Estimated Value: $538,000 - $588,000
4
Beds
3
Baths
2,542
Sq Ft
$223/Sq Ft
Est. Value
About This Home
This home is located at 1530 Hidden Creek Point, Cumming, GA 30040 and is currently estimated at $567,973, approximately $223 per square foot. 1530 Hidden Creek Point is a home located in Forsyth County with nearby schools including Kelly Mill Elementary School, Forsyth Central High School, and Milton Montessori School.
Ownership History
Date
Name
Owned For
Owner Type
Purchase Details
Closed on
Nov 30, 2010
Sold by
Federal Home Loan Mortgage Corporation
Bought by
Anderson George R and Anderson Stacy L
Current Estimated Value
Home Financials for this Owner
Home Financials are based on the most recent Mortgage that was taken out on this home.
Original Mortgage
$192,006
Outstanding Balance
$128,012
Interest Rate
4.4%
Mortgage Type
FHA
Estimated Equity
$439,961
Purchase Details
Closed on
Oct 5, 2010
Sold by
Suntrust Mtg Inc
Bought by
Federal Home Loan Mortgage Corporation
Home Financials for this Owner
Home Financials are based on the most recent Mortgage that was taken out on this home.
Original Mortgage
$192,006
Outstanding Balance
$128,012
Interest Rate
4.4%
Mortgage Type
FHA
Estimated Equity
$439,961
Purchase Details
Closed on
Mar 11, 2005
Sold by
Mdc Hearrtstone Ga Llc
Bought by
Mccar Homes Inc
Create a Home Valuation Report for This Property
The Home Valuation Report is an in-depth analysis detailing your home's value as well as a comparison with similar homes in the area
Home Values in the Area
Average Home Value in this Area
Purchase History
| Date | Buyer | Sale Price | Title Company |
|---|---|---|---|
| Anderson George R | -- | -- | |
| Federal Home Loan Mortgage Corporation | -- | -- | |
| Suntrust Mtg Inc | $199,488 | -- | |
| Mccar Homes Inc | $242,300 | -- |
Source: Public Records
Mortgage History
| Date | Status | Borrower | Loan Amount |
|---|---|---|---|
| Open | Anderson George R | $192,006 |
Source: Public Records
Tax History Compared to Growth
Tax History
| Year | Tax Paid | Tax Assessment Tax Assessment Total Assessment is a certain percentage of the fair market value that is determined by local assessors to be the total taxable value of land and additions on the property. | Land | Improvement |
|---|---|---|---|---|
| 2025 | $4,417 | $221,556 | $74,000 | $147,556 |
| 2024 | $4,417 | $218,948 | $68,000 | $150,948 |
| 2023 | $3,688 | $196,848 | $60,000 | $136,848 |
| 2022 | $3,722 | $134,244 | $40,000 | $94,244 |
| 2021 | $3,383 | $134,244 | $40,000 | $94,244 |
| 2020 | $3,276 | $129,064 | $40,000 | $89,064 |
| 2019 | $3,070 | $118,884 | $26,000 | $92,884 |
| 2018 | $3,036 | $116,824 | $26,000 | $90,824 |
| 2017 | $2,879 | $108,852 | $28,000 | $80,852 |
| 2016 | $2,853 | $107,612 | $20,000 | $87,612 |
| 2015 | $2,706 | $100,492 | $20,000 | $80,492 |
| 2014 | -- | $91,272 | $0 | $0 |
Source: Public Records
Map
Nearby Homes
- 1930 Stardust Trail
- 4540 Natchez Ln
- 113 Hickory Trail
- 825 Mill Garden Place
- 1620 Greystone Rd
- 3995 Village Estates Ct
- 4010 Village Estates Ct
- 517 Kelly Mill Rd
- 1775 Lantana Trail
- 516 Kelly Mill Rd Unit LAND
- 516 Kelly Mill Rd Unit HOME
- 516 Kelly Mill Rd
- 1905 Barrett Dr
- 3428 Castleberry Village Cir Unit 47
- 3830 Village Estates Ct Unit 3
- 2045 Crossover Dr
- 1793 Johnson Rd
- 213 Pine Crest Dr
- 4510 Natchez Ln
- 1520 Hidden Creek Point
- 1540 Hidden Creek Point
- 1510 Hidden Creek Point
- 1535 Hidden Creek Point
- 1550 Hidden Creek Point
- 1510 Dawn Valley Trail
- 1510 Dawn Valley Trail Unit 195
- 1555 Hidden Creek Point
- 1430 Hidden Creek Point
- 1560 Hidden Creek
- 1560 Hidden Creek Point
- 1520 Dawn Valley Trail
- 1575 Hidden Creek Point
- 1420 Hidden Creek Point
- 1570 Hidden Creek Point
- 1425 Hidden Creek Point
- 1530 Dawn Valley Trail
- 1580 Hidden Creek Point Unit 209
- 1580 Hidden Creek Point
- 1580 Hidden Creek Point