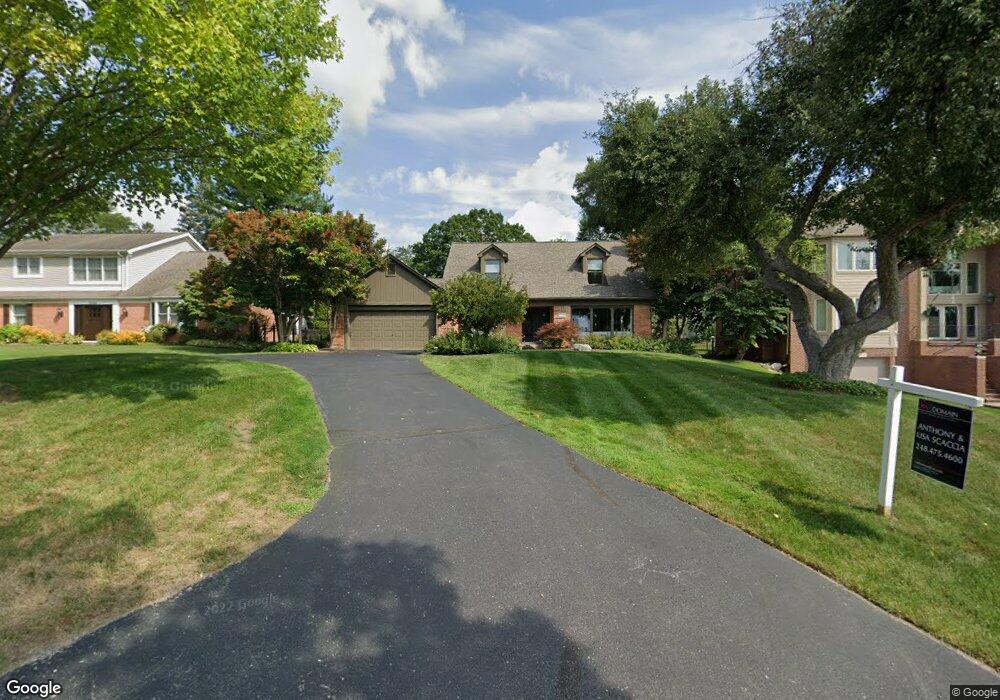
1530 Northlawn Blvd Unit Bldg-Unit Birmingham, MI 48009
Estimated Value: $1,134,665 - $1,444,000
3
Beds
5
Baths
3,040
Sq Ft
$434/Sq Ft
Est. Value
About This Home
This home is located at 1530 Northlawn Blvd Unit Bldg-Unit, Birmingham, MI 48009 and is currently estimated at $1,319,916, approximately $434 per square foot. 1530 Northlawn Blvd Unit Bldg-Unit is a home located in Oakland County with nearby schools including Pierce Elementary School, Derby Middle School, and Ernest W. Seaholm High School.
Ownership History
Date
Name
Owned For
Owner Type
Purchase Details
Closed on
Sep 12, 2018
Sold by
Russell Albert C and Russell Dairesse Madelne
Bought by
Sarafa Victoria S and Victoria S Sarafa Revocable Tr
Current Estimated Value
Purchase Details
Closed on
May 26, 2015
Sold by
Russell Albert C
Bought by
Russell Albert C and Carpenter Dairesse Madelaine
Purchase Details
Closed on
Feb 20, 2015
Sold by
Marangon Mark and Flm Llc
Bought by
Russell Albert C
Purchase Details
Closed on
Jul 29, 2014
Sold by
Talmer Bank & Trust
Bought by
Flm Llc
Purchase Details
Closed on
Nov 5, 2013
Sold by
Saab Theresa A and Mc Cuen Les C
Bought by
First Place Bank
Purchase Details
Closed on
Aug 22, 2003
Sold by
Mccuen Saab Theresa
Bought by
Mccuen Saab Theresa and Mccuen Les S
Purchase Details
Closed on
Aug 6, 2003
Sold by
Mouw Garrett C and Mouw Susan M
Bought by
Saab Theresa A
Create a Home Valuation Report for This Property
The Home Valuation Report is an in-depth analysis detailing your home's value as well as a comparison with similar homes in the area
Home Values in the Area
Average Home Value in this Area
Purchase History
| Date | Buyer | Sale Price | Title Company |
|---|---|---|---|
| Sarafa Victoria S | $855,000 | None Available | |
| Russell Albert C | -- | None Available | |
| Russell Albert C | $798,500 | Bankers Title Settlement Svc | |
| Flm Llc | $460,000 | None Available | |
| First Place Bank | $604,453 | None Available | |
| Mccuen Saab Theresa | -- | -- | |
| Saab Theresa A | $725,000 | Philip R Seaver Title Co Inc |
Source: Public Records
Tax History Compared to Growth
Tax History
| Year | Tax Paid | Tax Assessment Tax Assessment Total Assessment is a certain percentage of the fair market value that is determined by local assessors to be the total taxable value of land and additions on the property. | Land | Improvement |
|---|---|---|---|---|
| 2024 | $16,063 | $488,700 | $0 | $0 |
| 2023 | $15,393 | $497,820 | $0 | $0 |
| 2022 | $16,504 | $474,930 | $0 | $0 |
| 2021 | $16,520 | $427,080 | $0 | $0 |
| 2020 | $14,719 | $405,820 | $0 | $0 |
| 2019 | $16,656 | $397,660 | $0 | $0 |
| 2018 | $16,384 | $384,940 | $0 | $0 |
| 2017 | $17,227 | $397,120 | $0 | $0 |
| 2016 | $17,382 | $396,370 | $0 | $0 |
| 2015 | -- | $408,760 | $0 | $0 |
| 2014 | -- | $319,990 | $0 | $0 |
| 2011 | -- | $247,820 | $0 | $0 |
Source: Public Records
Map
Nearby Homes
- 1570 Northlawn Blvd
- 1345 Fairway Dr
- 999 Pleasant Ave
- 1395 Northlawn Blvd
- 1300 Northlawn Blvd
- 1057 Arlington St
- 1053 Canterbury St
- 1897 Norfolk St
- 520 Pleasant St
- 2248 W Lincoln St
- 633 Hawthorne St
- 834 Southfield Rd
- 955 Wakefield St
- 1541 Shipman Blvd
- 776 W Lincoln St
- 2330 Fairway Dr
- 1850 Shipman Blvd
- 730 Wallace St
- 394 S Glenhurst Dr
- 1992 Shipman Blvd
- 1530 Northlawn Blvd
- 1548 Northlawn Blvd
- 1516 Northlawn Blvd
- 1535 Fairway Dr
- 1515 Fairway Dr
- 1565 Fairway Dr
- 1492 Northlawn Blvd
- 1575 Fairway Dr
- 1473 Fairway Dr
- 1596 Northlawn Blvd
- 1587 Fairway Dr
- 1478 Northlawn Blvd
- 1595 Northlawn Blvd
- 1431 Fairway Dr
- 1540 Fairway Dr
- 1562 Fairway Dr
- 1524 Fairway Dr
- 1350 Fairway Dr
- 1506 Fairway Dr
- 1346 Fairway Dr