


1530 Olive Branch Rd Ellabell, GA 31308
Estimated payment $3,411/month
About This Home
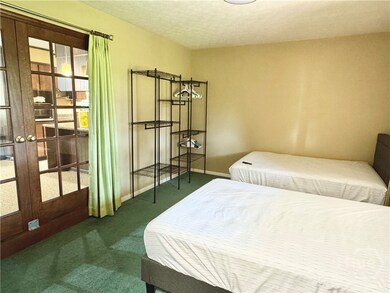
Introducing a freshly renovated brick home set on 5.6 acres of private land, this property delivers a peaceful country feel while being just 1.8 miles from the Hyundai plant and only a short drive to I-16. The kitchen is a true centerpiece, featuring a vented hood, ample cabinet space, and included appliances for a ready-to-enjoy cooking experience. You’ll love the added flexibility of 4 bedrooms, 4 full bathrooms, a formal dining, along with a cozy fireplace in the living room. There's also a spacious bonus room—perfect for a home theater, playroom, fitness area, or whatever suits your lifestyle. Outside, a large screened porch with a built-in sink makes hosting outdoor events effortless. A large workshop and additional shed provide plenty of space for tools, projects, or extra storage. This home combines the best of rural charm with practical updates and unbeatable proximity to major routes and employers. Don’t miss your chance to own this rare slice of quiet comfort.
Listing Agent
Bella Lee
Heritage South Realty License #427303 Listed on: 05/24/2025
Map
Home Details
Home Type
Single Family
Year Built
1973
Lot Details
0
Listing Details
- Property Type: Residential
- Stories: 1
- Year Built: 1973
- Special Features: None
- Property Sub Type: Detached
Interior Features
- Interior Amenities: Breakfast Bar, Breakfast Area, Ceiling Fan(s), Central Vacuum, Double Vanity, Pull Down Attic Stairs, Fireplace
Exterior Features
- Roof: Composition
Utilities
- Utilities: Cable Available
- Water Source: Private, Well
Lot Info
- Zoning: A-5
MLS Schools
- Elementary School: Bryan County
- High School: Bryan County
Home Values in the Area
Average Home Value in this Area
Tax History
| Year | Tax Paid | Tax Assessment Tax Assessment Total Assessment is a certain percentage of the fair market value that is determined by local assessors to be the total taxable value of land and additions on the property. | Land | Improvement |
|---|---|---|---|---|
| 2024 | $3,115 | $116,480 | $20,360 | $96,120 |
| 2023 | $3,062 | $119,880 | $58,640 | $61,240 |
| 2022 | $2,042 | $118,560 | $58,640 | $59,920 |
| 2021 | $1,981 | $114,320 | $58,640 | $55,680 |
| 2020 | $2,783 | $111,800 | $56,120 | $55,680 |
| 2019 | $1,015 | $74,480 | $20,600 | $53,880 |
| 2018 | $850 | $70,400 | $16,480 | $53,920 |
| 2017 | $794 | $70,264 | $16,480 | $53,784 |
| 2016 | $750 | $68,264 | $16,480 | $51,784 |
| 2015 | $732 | $67,504 | $16,480 | $51,024 |
| 2014 | $733 | $67,520 | $16,480 | $51,040 |
Property History
| Date | Event | Price | List to Sale | Price per Sq Ft | Prior Sale |
|---|---|---|---|---|---|
| 05/24/2025 05/24/25 | For Sale | $675,000 | +32.4% | $253 / Sq Ft | |
| 06/29/2023 06/29/23 | Sold | $510,000 | -2.9% | $205 / Sq Ft | View Prior Sale |
| 04/28/2023 04/28/23 | Pending | -- | -- | -- | |
| 03/14/2023 03/14/23 | For Sale | $525,000 | -- | $212 / Sq Ft |
Purchase History
| Date | Type | Sale Price | Title Company |
|---|---|---|---|
| Deed | -- | -- | |
| Deed | -- | -- |
Source: Hive MLS
MLS Number: SA331624
APN: 0291-041
Disclaimer: Certain information contained herein is derived from information provided by parties other than Homes.com. All information provided is deemed reliable, but is not guaranteed to be accurate and should be independently verified.
![]() IDX information is provided exclusively for personal, non-commercial use, and may not be used for any purpose other than to identify prospective properties consumers may be interested in purchasing.
IDX information is provided exclusively for personal, non-commercial use, and may not be used for any purpose other than to identify prospective properties consumers may be interested in purchasing.
Information is deemed reliable but not guaranteed.
- 1560 Olive Branch Rd
- 0 Us 80 Hwy Unit 322296
- 0 Pine Needle Dr Unit 281939
- 145 Worthington Dr
- 535 & 565 Deer Run Rd
- 1000 Pine Needle Dr
- 32 Sheridan Ct
- 29 Sterling Ct
- 965 Old Olive Branch Rd
- 58 Westhampton Dr
- 38 Westhampton Dr
- 641 US Highway 80 E
- 8303 Us Hwy 280
- 8303 U S Highway 280
- 641 U S 80
- 220 U S 80
- 12010 Highway 280 E
- 0 Wilma Edwards Rd Unit 10510556
- 000 Wilma Edwards Rd
- 82 Saddlebrush Rd
- 30 Aaron Dr
- 534 Cobblestone Cir
- 203 River Oak Dr
- 105 Shelton Dr
- 25 Hamilton Ct
- 1534 Midland Rd
- 297 W East Smith Rd
- 281 W East Smith Rd
- 391 Coconut Dr
- 397 Coconut Dr
- 3567 Blue Jay Rd
- 474 Coconut Dr
- 459 Coconut Dr
- 470 Coconut Dr
- 412 Coconut Dr
- 457 Coconut Dr
- 667 Roebling Rd
- 74 Front Run Place
- 214 Coneflower Rd
- 149 Coneflower Rd