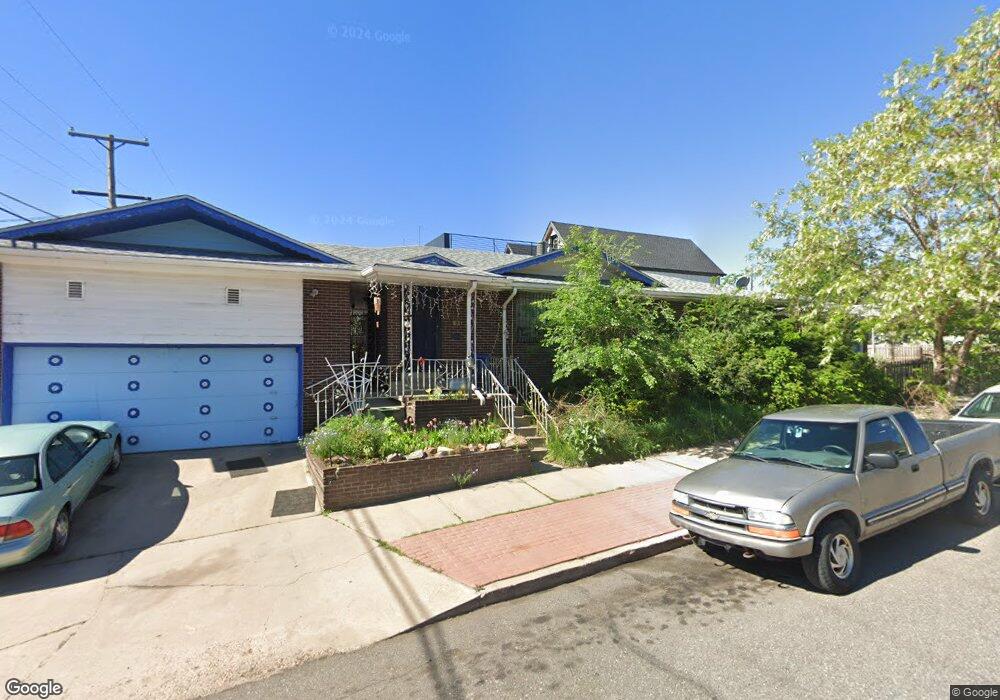
1530 W 34th Ave Denver, CO 80211
Highland NeighborhoodEstimated Value: $764,000 - $826,539
3
Beds
2
Baths
1,365
Sq Ft
$588/Sq Ft
Est. Value
About This Home
This home is located at 1530 W 34th Ave, Denver, CO 80211 and is currently estimated at $802,385, approximately $587 per square foot. 1530 W 34th Ave is a home located in Denver County with nearby schools including Bryant Webster Dual Language School, Denver Montessori Junior/Senior High School, and Skinner Middle School.
Ownership History
Date
Name
Owned For
Owner Type
Purchase Details
Closed on
Mar 3, 2006
Sold by
Thompson Greg Alan and Thompson Greg Allen
Bought by
Segura Roberta F and Segura Benjamin L
Current Estimated Value
Home Financials for this Owner
Home Financials are based on the most recent Mortgage that was taken out on this home.
Original Mortgage
$159,200
Outstanding Balance
$94,937
Interest Rate
7.12%
Mortgage Type
New Conventional
Estimated Equity
$707,448
Purchase Details
Closed on
Mar 28, 2000
Sold by
Scheitler Frank I
Bought by
Thompson Greg Allen
Home Financials for this Owner
Home Financials are based on the most recent Mortgage that was taken out on this home.
Original Mortgage
$249,600
Interest Rate
8.27%
Create a Home Valuation Report for This Property
The Home Valuation Report is an in-depth analysis detailing your home's value as well as a comparison with similar homes in the area
Home Values in the Area
Average Home Value in this Area
Purchase History
| Date | Buyer | Sale Price | Title Company |
|---|---|---|---|
| Segura Roberta F | $199,000 | Land Title | |
| Thompson Greg Allen | $312,000 | -- |
Source: Public Records
Mortgage History
| Date | Status | Borrower | Loan Amount |
|---|---|---|---|
| Open | Segura Roberta F | $159,200 | |
| Previous Owner | Thompson Greg Allen | $249,600 |
Source: Public Records
Tax History Compared to Growth
Tax History
| Year | Tax Paid | Tax Assessment Tax Assessment Total Assessment is a certain percentage of the fair market value that is determined by local assessors to be the total taxable value of land and additions on the property. | Land | Improvement |
|---|---|---|---|---|
| 2024 | $4,515 | $57,010 | $41,290 | $15,720 |
| 2023 | $4,418 | $57,010 | $41,290 | $15,720 |
| 2022 | $4,086 | $51,380 | $28,710 | $22,670 |
| 2021 | $3,944 | $52,860 | $29,540 | $23,320 |
| 2020 | $3,449 | $46,490 | $24,620 | $21,870 |
| 2019 | $3,353 | $46,490 | $24,620 | $21,870 |
| 2018 | $3,208 | $41,470 | $23,540 | $17,930 |
| 2017 | $3,199 | $41,470 | $23,540 | $17,930 |
| 2016 | $2,716 | $33,310 | $18,499 | $14,811 |
| 2015 | $2,602 | $33,310 | $18,499 | $14,811 |
| 2014 | $2,240 | $26,970 | $12,465 | $14,505 |
Source: Public Records
Map
Nearby Homes
- 3409 Navajo St
- 3410 Pecos St
- 3452 Osage St
- 3361 Mariposa St
- 3444 Navajo St Unit 12
- 3444 Navajo St Unit 10
- 3217 Osage St
- 3356 Quivas St
- 3547 Osage St
- 1801 W 33rd Ave
- 3451 Quivas St
- 3227 Quivas St Unit 1
- 1505 W 36th Ave
- 3600 N Pecos St
- 3619 Navajo St
- 1845 W 33rd Ave
- 1819 W 32nd Ave
- 1843 W 35th Ave
- 3636 Osage St
- 3628 Navajo St
- 1530 W 34th Ave Unit 1534
- 1534 W 34th Ave
- 3342 Osage St
- 3347 Navajo St
- 3349 Navajo St
- 3338 Osage St
- 3400 Osage St
- 3357 Navajo St
- 3334 Osage St
- 3332 Osage St
- 3401 Navajo St
- 3403 Navajo St
- 3345 Navajo St
- 3405 Navajo St
- 3407 Navajo St
- 3405 Navajo St
- 3339 Navajo St
- 3337 Navajo St
- 3337 Navajo St
- 3412 Osage St