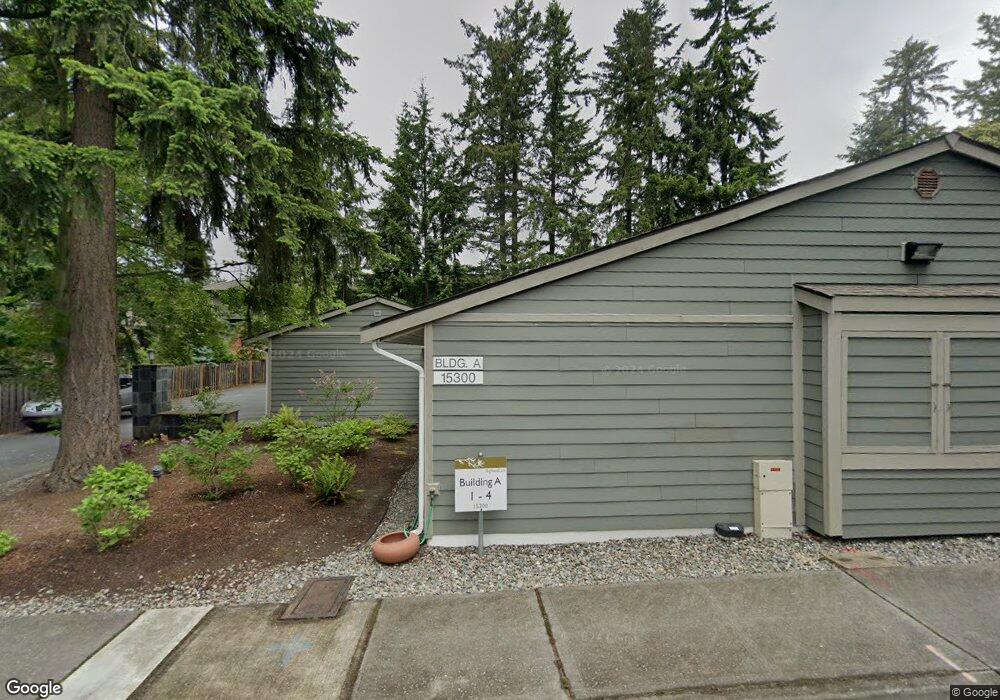
15300 NE 15th Place Unit B8 Bellevue, WA 98007
Crossroads NeighborhoodEstimated Value: $468,572 - $808,000
2
Beds
2
Baths
894
Sq Ft
$666/Sq Ft
Est. Value
About This Home
This home is located at 15300 NE 15th Place Unit B8, Bellevue, WA 98007 and is currently estimated at $595,143, approximately $665 per square foot. 15300 NE 15th Place Unit B8 is a home located in King County with nearby schools including Stevenson Elementary School, Ringdall Junior High School, and Interlake High School.
Ownership History
Date
Name
Owned For
Owner Type
Purchase Details
Closed on
Oct 15, 2018
Sold by
Baah Eugene
Bought by
Gardner Montie A
Current Estimated Value
Home Financials for this Owner
Home Financials are based on the most recent Mortgage that was taken out on this home.
Original Mortgage
$418,500
Outstanding Balance
$365,734
Interest Rate
4.6%
Estimated Equity
$229,410
Purchase Details
Closed on
Apr 20, 2010
Sold by
Huh Michael
Bought by
Baah Eugene
Home Financials for this Owner
Home Financials are based on the most recent Mortgage that was taken out on this home.
Original Mortgage
$280,000
Interest Rate
4.91%
Purchase Details
Closed on
Nov 12, 2008
Sold by
Highland Lane Condominium Llc
Bought by
Huh Michael K
Home Financials for this Owner
Home Financials are based on the most recent Mortgage that was taken out on this home.
Original Mortgage
$370,490
Interest Rate
5.5%
Mortgage Type
Purchase Money Mortgage
Create a Home Valuation Report for This Property
The Home Valuation Report is an in-depth analysis detailing your home's value as well as a comparison with similar homes in the area
Home Values in the Area
Average Home Value in this Area
Purchase History
| Date | Buyer | Sale Price | Title Company |
|---|---|---|---|
| Gardner Montie A | $465,000 | Wfg National Title Company O | |
| Baah Eugene | $280,000 | Chicago Title | |
| Huh Michael K | $389,990 | Pacific Nw Tit |
Source: Public Records
Mortgage History
| Date | Status | Borrower | Loan Amount |
|---|---|---|---|
| Open | Gardner Montie A | $418,500 | |
| Previous Owner | Baah Eugene | $280,000 | |
| Previous Owner | Huh Michael K | $370,490 |
Source: Public Records
Tax History Compared to Growth
Tax History
| Year | Tax Paid | Tax Assessment Tax Assessment Total Assessment is a certain percentage of the fair market value that is determined by local assessors to be the total taxable value of land and additions on the property. | Land | Improvement |
|---|---|---|---|---|
| 2024 | $3,177 | $431,000 | $189,500 | $241,500 |
| 2023 | $3,766 | $532,000 | $189,500 | $342,500 |
| 2022 | $3,888 | $530,000 | $189,600 | $340,400 |
| 2021 | $3,741 | $472,000 | $145,800 | $326,200 |
| 2020 | $3,700 | $421,000 | $145,800 | $275,200 |
| 2018 | $3,221 | $367,000 | $116,600 | $250,400 |
| 2017 | $2,829 | $349,000 | $102,100 | $246,900 |
| 2016 | $2,841 | $323,000 | $55,400 | $267,600 |
| 2015 | $2,816 | $322,000 | $49,500 | $272,500 |
| 2014 | -- | $316,000 | $49,500 | $266,500 |
| 2013 | -- | $214,000 | $49,500 | $164,500 |
Source: Public Records
Map
Nearby Homes
- 1415 154th Ave NE Unit 4101
- 1822 152nd Ave NE Unit E-308
- 1750 152nd Ave NE Unit W110
- 1434 157th Place NE Unit 2802
- 1732 157th Ave NE Unit B104
- 15788 NE 14th Alley
- 15768 NE 14th Terrace
- 15047 NE 12th St
- 15865 Northup Way Unit 41
- 14831 NE 14th St
- 14919 NE 10th Place
- 1711 159th Place NE Unit 29
- 15208 NE 8th St Unit C3
- 15214 NE 8th St Unit G14
- 15322 NE 7th Place
- 15001 NE 8th Place
- 14460 NE 16th Place
- 16225 Northup Way Unit A202
- 1613 165th Ave NE
- 14870 Site 5 NE 2nd Ct
- 15300 NE 15th Place Unit 3
- 15300 NE 15th Place Unit 4
- 15300 NE 15th Place Unit 8
- 15300 NE 15th Place Unit D24
- 15300 NE 15th Place Unit D23
- 15300 NE 15th Place Unit D22
- 15300 NE 15th Place Unit D21
- 15300 NE 15th Place Unit D20
- 15300 NE 15th Place Unit D19
- 15300 NE 15th Place Unit D18
- 15300 NE 15th Place Unit D17
- 15300 NE 15th Place Unit C16
- 15300 NE 15th Place Unit C15
- 15300 NE 15th Place Unit C14
- 15300 NE 15th Place Unit C13
- 15300 NE 15th Place Unit C12
- 15300 NE 15th Place Unit C11
- 15300 NE 15th Place Unit C10
- 15300 NE 15th Place Unit C9
- 15300 NE 15th Place Unit B7