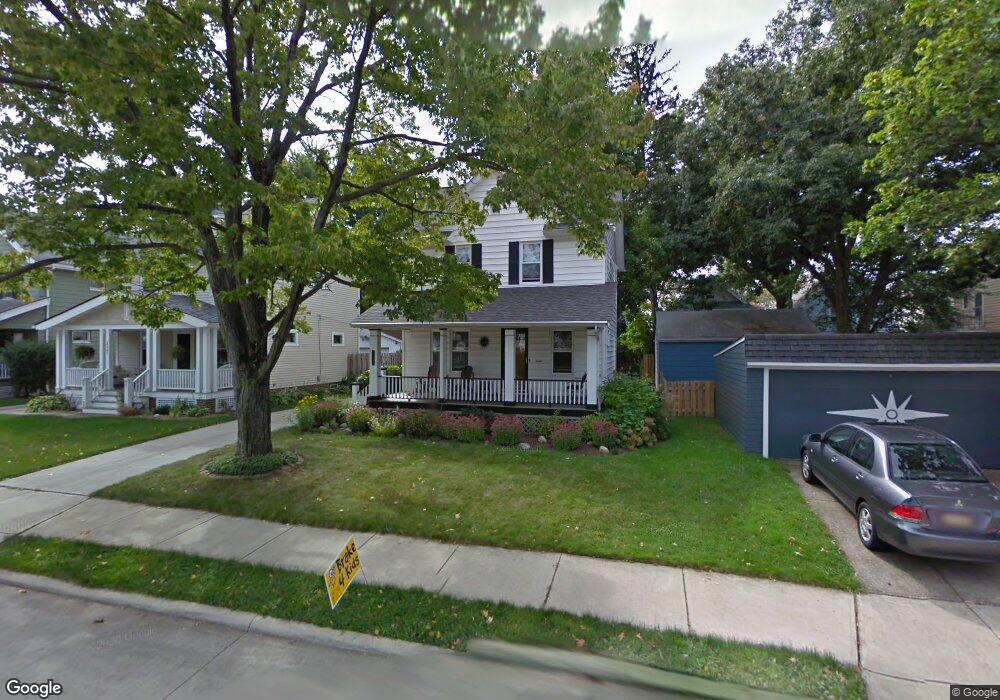
15305 Lanning Ave Lakewood, OH 44107
Estimated Value: $249,000 - $335,000
3
Beds
1
Bath
1,218
Sq Ft
$233/Sq Ft
Est. Value
About This Home
This home is located at 15305 Lanning Ave, Lakewood, OH 44107 and is currently estimated at $283,504, approximately $232 per square foot. 15305 Lanning Ave is a home located in Cuyahoga County with nearby schools including Hayes Elementary School, Harding Middle School, and Lakewood High School.
Ownership History
Date
Name
Owned For
Owner Type
Purchase Details
Closed on
Sep 23, 1997
Sold by
Juba David M
Bought by
Campbell Glenn R and Sweany Juliet
Current Estimated Value
Home Financials for this Owner
Home Financials are based on the most recent Mortgage that was taken out on this home.
Original Mortgage
$78,400
Outstanding Balance
$12,236
Interest Rate
7.55%
Mortgage Type
New Conventional
Estimated Equity
$271,269
Purchase Details
Closed on
Sep 15, 1993
Sold by
Thomas Joseph J and Thomas Mary A
Bought by
Juba David M
Purchase Details
Closed on
Oct 29, 1992
Sold by
Thomas Joseph J
Bought by
Thomas Joseph J and Thomas Mary A
Purchase Details
Closed on
Sep 4, 1984
Sold by
Thomas Joseph J and Thomas Mary A
Bought by
Thomas Joseph J
Purchase Details
Closed on
Jan 1, 1975
Bought by
Thomas Joseph J and Thomas Mary A
Create a Home Valuation Report for This Property
The Home Valuation Report is an in-depth analysis detailing your home's value as well as a comparison with similar homes in the area
Home Values in the Area
Average Home Value in this Area
Purchase History
| Date | Buyer | Sale Price | Title Company |
|---|---|---|---|
| Campbell Glenn R | $92,300 | -- | |
| Juba David M | $89,000 | -- | |
| Thomas Joseph J | -- | -- | |
| Thomas Joseph J | -- | -- | |
| Thomas Joseph J | -- | -- |
Source: Public Records
Mortgage History
| Date | Status | Borrower | Loan Amount |
|---|---|---|---|
| Open | Campbell Glenn R | $78,400 |
Source: Public Records
Tax History Compared to Growth
Tax History
| Year | Tax Paid | Tax Assessment Tax Assessment Total Assessment is a certain percentage of the fair market value that is determined by local assessors to be the total taxable value of land and additions on the property. | Land | Improvement |
|---|---|---|---|---|
| 2024 | $4,514 | $70,280 | $18,445 | $51,835 |
| 2023 | $4,374 | $58,280 | $15,370 | $42,910 |
| 2022 | $4,402 | $58,275 | $15,365 | $42,910 |
| 2021 | $4,357 | $58,280 | $15,370 | $42,910 |
| 2020 | $3,862 | $45,150 | $11,900 | $33,250 |
| 2019 | $3,785 | $129,000 | $34,000 | $95,000 |
| 2018 | $3,692 | $45,150 | $11,900 | $33,250 |
| 2017 | $3,629 | $39,380 | $9,070 | $30,310 |
| 2016 | $3,604 | $39,380 | $9,070 | $30,310 |
| 2015 | $3,607 | $39,380 | $9,070 | $30,310 |
| 2014 | $3,607 | $37,880 | $8,720 | $29,160 |
Source: Public Records
Map
Nearby Homes
- 2165 Arthur Ave
- 14926 Esther Ave
- 14924 Delaware Ave
- 14924 Arden Ave
- 14909 Arden Ave
- 2230 Alger Rd
- 2209 Alger Rd
- 15615 Fernway Ave
- 2263 Warren Rd
- 14428 Delaware Ave
- 2234 Olive Ave
- 2099 Olive Ave
- 14404 Bayes Ave
- 2239 Woodward Ave
- 2209 Woodward Ave
- 15555 Hilliard Rd Unit 401A
- 3158 W 159th St
- 2223 Eldred Ave
- 2078 Baxterly Ave
- 1617 Westwood Ave
- 15301 Lanning Ave
- 15297 Lanning Ave
- 2201 Mars Ave
- 2197 Mars Ave
- 2205 Mars Ave
- 14960 Delaware Ave
- 14964 Delaware Ave
- 14958 Delaware Ave
- 15123 Lanning Ave
- 14968 Delaware Ave
- 14952 Delaware Ave
- 2189 Mars Ave
- 14972 Delaware Ave
- 15119 Lanning Ave
- 14948 Delaware Ave
- 15304 Lanning Ave
- 15302 Lanning Ave
- 2185 Mars Ave
- 15126 Lanning Ave
- 14944 Delaware Ave