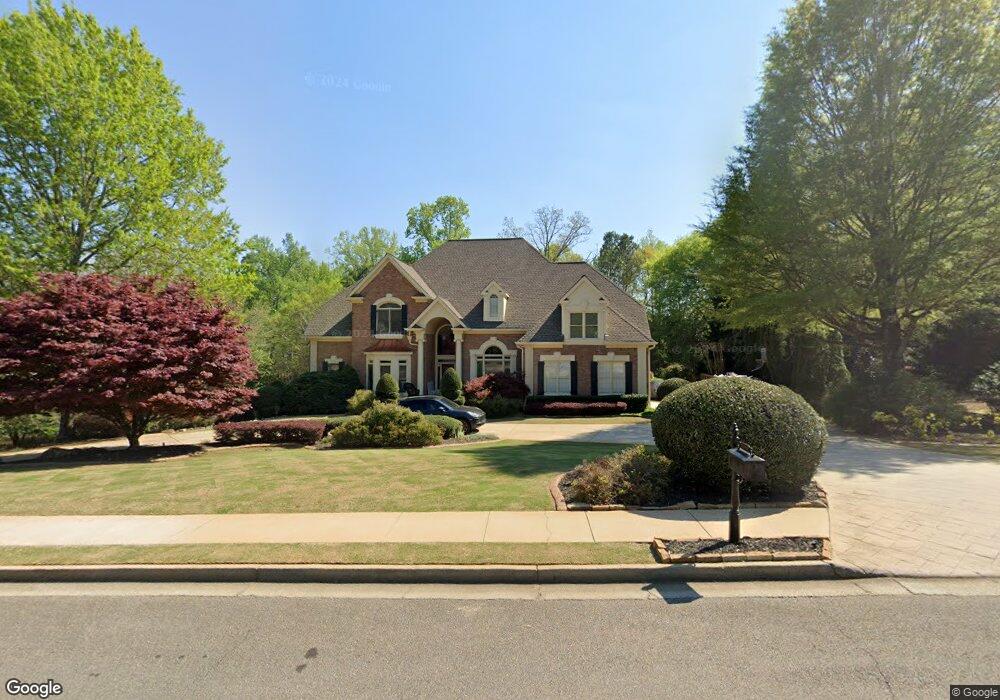
15305 White Columns Dr Unit IVB Alpharetta, GA 30004
Estimated Value: $1,460,000 - $1,657,000
4
Beds
5
Baths
5,603
Sq Ft
$279/Sq Ft
Est. Value
About This Home
This home is located at 15305 White Columns Dr Unit IVB, Alpharetta, GA 30004 and is currently estimated at $1,565,244, approximately $279 per square foot. 15305 White Columns Dr Unit IVB is a home located in Fulton County with nearby schools including Birmingham Falls Elementary School, Northwestern Middle School, and Cambridge High School.
Ownership History
Date
Name
Owned For
Owner Type
Purchase Details
Closed on
Apr 2, 2007
Sold by
Dmeza Jay E Jr
Bought by
Dmeza Jay E Jr and Dmeza Amelia B
Current Estimated Value
Home Financials for this Owner
Home Financials are based on the most recent Mortgage that was taken out on this home.
Original Mortgage
$600,000
Outstanding Balance
$362,776
Interest Rate
6.15%
Mortgage Type
New Conventional
Estimated Equity
$1,202,468
Purchase Details
Closed on
May 15, 2000
Sold by
Milton Jones Homes Inc
Bought by
D'Meza Jay E and D'Meza Amelia B
Home Financials for this Owner
Home Financials are based on the most recent Mortgage that was taken out on this home.
Original Mortgage
$252,000
Interest Rate
8.14%
Mortgage Type
New Conventional
Create a Home Valuation Report for This Property
The Home Valuation Report is an in-depth analysis detailing your home's value as well as a comparison with similar homes in the area
Home Values in the Area
Average Home Value in this Area
Purchase History
| Date | Buyer | Sale Price | Title Company |
|---|---|---|---|
| Dmeza Jay E Jr | -- | -- | |
| Dmeza Jay E Jr | -- | -- | |
| D'Meza Jay E | $575,000 | -- |
Source: Public Records
Mortgage History
| Date | Status | Borrower | Loan Amount |
|---|---|---|---|
| Open | Dmeza Jay E Jr | $600,000 | |
| Previous Owner | D'Meza Jay E | $252,000 | |
| Previous Owner | D'Meza Jay E | $180,000 |
Source: Public Records
Tax History Compared to Growth
Tax History
| Year | Tax Paid | Tax Assessment Tax Assessment Total Assessment is a certain percentage of the fair market value that is determined by local assessors to be the total taxable value of land and additions on the property. | Land | Improvement |
|---|---|---|---|---|
| 2025 | $1,629 | $545,120 | $129,200 | $415,920 |
| 2023 | $13,771 | $487,880 | $73,120 | $414,760 |
| 2022 | $8,211 | $343,880 | $65,640 | $278,240 |
| 2021 | $7,561 | $290,320 | $53,520 | $236,800 |
| 2020 | $7,888 | $295,640 | $58,400 | $237,240 |
| 2019 | $1,549 | $304,520 | $51,920 | $252,600 |
| 2018 | $7,953 | $297,360 | $50,680 | $246,680 |
| 2017 | $8,165 | $297,360 | $50,680 | $246,680 |
| 2016 | $8,420 | $312,920 | $58,440 | $254,480 |
| 2015 | $9,861 | $312,920 | $58,440 | $254,480 |
| 2014 | $7,945 | $271,920 | $56,080 | $215,840 |
Source: Public Records
Map
Nearby Homes
- 325 White Columns Ct
- 15475 Birmingham Hwy
- 1160 Nix Rd
- 310 Glen Hampton Place
- 15380 Birmingham Hwy
- 15630 Birmingham Hwy
- 1004 Crossroads Trail
- 4000 Orchard Way
- 1009 Crossroads Trail
- 1013 Crossroads Trail
- 1025 Crossroads Trail
- 2035 Village Walk
- 2031 Village Walk
- 711 Hallbrook Ct
- 115 von Lake Dr
- 608 Glenover Dr
- 110 von Lake Dr
- 240 Brock Trail
- 240 Brock Trail Unit 4
- 235 Brock Trail
- 15315 White Columns Dr Unit IVB
- 15295 White Columns Dr
- 420 Highlands Manor Ct
- 430 Highlands Manor Ct
- 15410 White Columns Dr
- 15400 White Columns Dr
- 15325 White Columns Dr
- 15420 White Columns Dr
- 15390 White Columns Dr
- 15285 White Columns Dr
- 15430 White Columns Dr
- 410 Highlands Manor Ct
- 425 Highlands Manor Ct Unit IVB
- 600 Treyburn Manor Dr
- 305 White Columns Ct Unit IVA
- 15380 White Columns Dr
- 415 Highlands Manor Ct
- 15275 White Columns Dr
- 950 Nix Rd