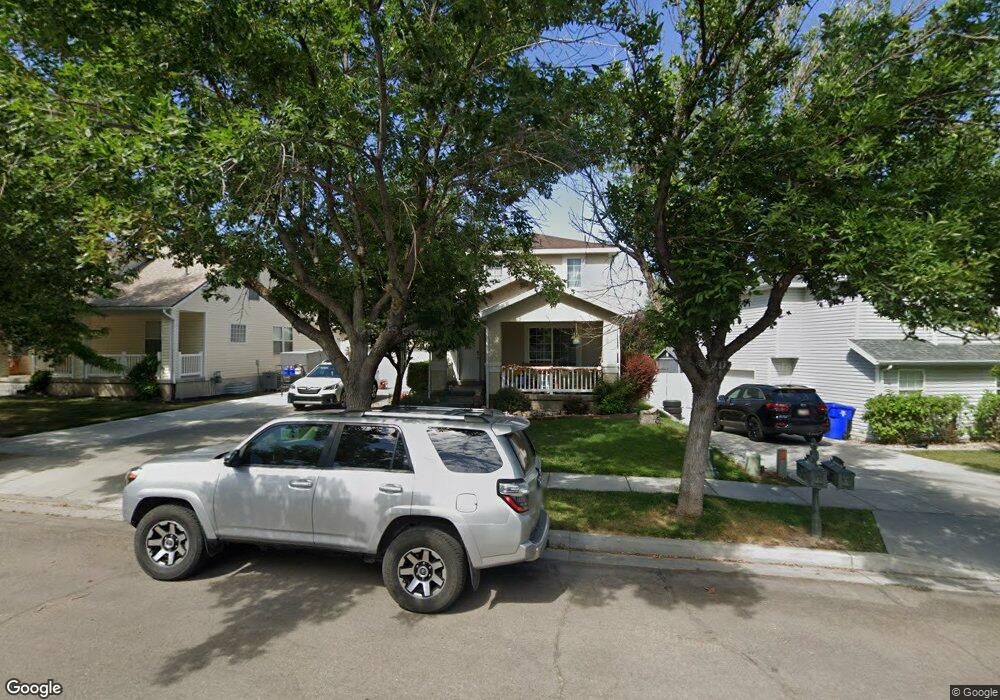
1531 Candellaria Dr Tooele, UT 84074
Estimated Value: $435,000 - $465,000
5
Beds
4
Baths
2,574
Sq Ft
$174/Sq Ft
Est. Value
About This Home
This home is located at 1531 Candellaria Dr, Tooele, UT 84074 and is currently estimated at $447,031, approximately $173 per square foot. 1531 Candellaria Dr is a home located in Tooele County with nearby schools including Overlake Elementary School, Clarke N. Johnsen Junior High School, and Stansbury High School.
Ownership History
Date
Name
Owned For
Owner Type
Purchase Details
Closed on
May 13, 2020
Sold by
Nicholes Brent
Bought by
Debrunner Deanna D
Current Estimated Value
Home Financials for this Owner
Home Financials are based on the most recent Mortgage that was taken out on this home.
Original Mortgage
$180,000
Outstanding Balance
$159,505
Interest Rate
3.3%
Mortgage Type
New Conventional
Estimated Equity
$287,526
Purchase Details
Closed on
Mar 12, 2015
Sold by
Schmale Albert F and Schmale Larena L
Bought by
Nicholes Brent
Home Financials for this Owner
Home Financials are based on the most recent Mortgage that was taken out on this home.
Original Mortgage
$204,081
Interest Rate
3.61%
Mortgage Type
New Conventional
Create a Home Valuation Report for This Property
The Home Valuation Report is an in-depth analysis detailing your home's value as well as a comparison with similar homes in the area
Home Values in the Area
Average Home Value in this Area
Purchase History
| Date | Buyer | Sale Price | Title Company |
|---|---|---|---|
| Debrunner Deanna D | -- | First American Title | |
| Nicholes Brent | -- | First American Title Co Llc |
Source: Public Records
Mortgage History
| Date | Status | Borrower | Loan Amount |
|---|---|---|---|
| Open | Debrunner Deanna D | $180,000 | |
| Previous Owner | Nicholes Brent | $204,081 |
Source: Public Records
Tax History Compared to Growth
Tax History
| Year | Tax Paid | Tax Assessment Tax Assessment Total Assessment is a certain percentage of the fair market value that is determined by local assessors to be the total taxable value of land and additions on the property. | Land | Improvement |
|---|---|---|---|---|
| 2025 | $3,173 | $464,960 | $95,000 | $369,960 |
| 2024 | $3,074 | $227,322 | $52,250 | $175,072 |
| 2023 | $2,806 | $252,926 | $49,770 | $203,156 |
| 2022 | $3,280 | $271,019 | $64,020 | $206,999 |
| 2021 | $2,650 | $182,048 | $19,525 | $162,523 |
| 2020 | $2,474 | $299,337 | $35,500 | $263,837 |
| 2019 | $2,299 | $275,352 | $35,500 | $239,852 |
| 2018 | $2,047 | $233,264 | $30,000 | $203,264 |
| 2017 | $1,593 | $214,785 | $30,000 | $184,785 |
| 2016 | $1,438 | $107,526 | $8,250 | $99,276 |
| 2015 | $1,438 | $102,026 | $0 | $0 |
| 2014 | -- | $102,026 | $0 | $0 |
Source: Public Records
Map
Nearby Homes
- 1557 Colavito Way
- 1558 Durocher Ln
- 295 Drysdale Way
- 422 W 1360 N
- 118 W High Cheddar
- 1444 N Berra Blvd Unit 231
- 1444 N Berra Blvd
- 1456 N Berra Blvd
- 132 W Ebbets Unit 255
- 132 W Ebbets
- 168 W 1320 N Unit 171
- 1403 N Baen Way
- 1403 N Baen Way Unit 233
- 1466 N Berra Blvd Unit 227
- 1413 N Baen Way Unit 230
- 1413 N Baen Way
- 183 W 1320 N Unit 169
- 183 W 1320 N
- 124 Ebbets Field
- 1368 N Baen Way
- 1543 Candellaria Dr
- 1521 Candellaria Dr
- 1389 Clemente Way Unit 210
- 1528 Colavito Way
- 1509 Candellaria Dr
- 1520 Colavito Way
- 1510 Colavito Way
- 1528 Candellaria Dr
- 1518 Candellaria Dr
- 1542 Candellaria Dr
- 1542 Candellaria Dr Unit 288
- 1510 Candellaria Dr
- 1565 Candellaria Dr
- 1538 Colavito Way
- 1552 Candellaria Dr
- 292 W 1480 N
- 284 W 1480 N
- 1548 Colavito Way
- 1562 Candellaria Dr
- 1562 Candellaria Dr Unit 290