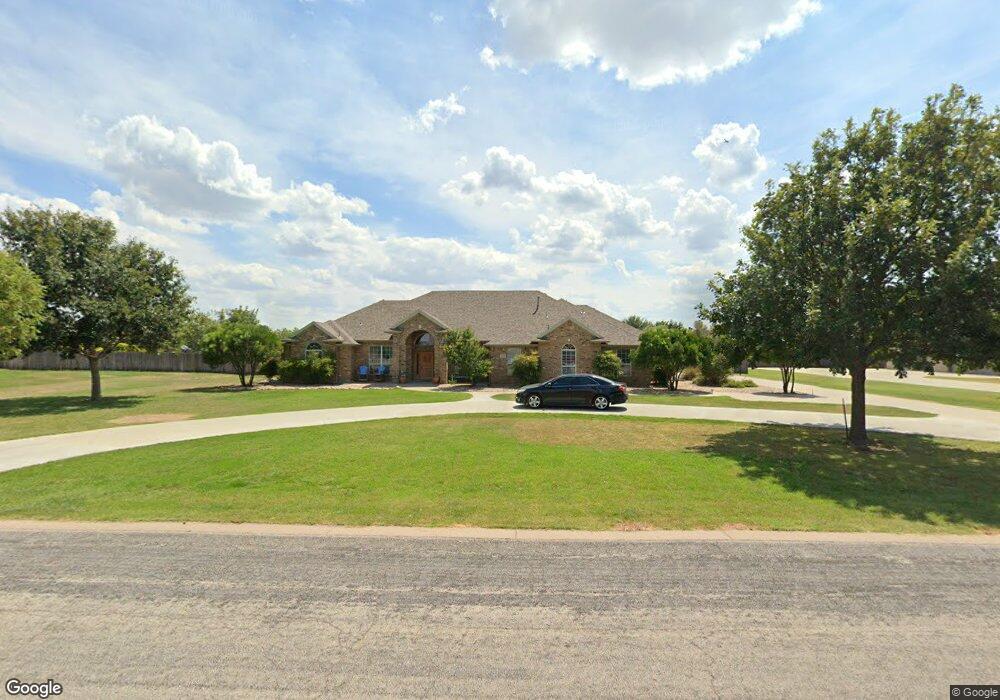
1531 Floyd Dr San Angelo, TX 76904
Bentwood Country Club Estates NeighborhoodEstimated Value: $626,000 - $826,000
--
Bed
--
Bath
2,856
Sq Ft
$241/Sq Ft
Est. Value
About This Home
This home is located at 1531 Floyd Dr, San Angelo, TX 76904 and is currently estimated at $689,653, approximately $241 per square foot. 1531 Floyd Dr is a home located in Tom Green County with nearby schools including Lamar Elementary School, Glenn Middle School, and Central High School.
Ownership History
Date
Name
Owned For
Owner Type
Purchase Details
Closed on
Feb 19, 2003
Sold by
Carroll Marvin Walter and Carroll Rhonda M
Bought by
Wilke Wilke R and Wilke Angela D
Current Estimated Value
Purchase Details
Closed on
Apr 3, 2002
Sold by
Carroll Marvin Walter and Carroll Rhonda M
Bought by
Wilke Wilke R and Wilke Angela D
Purchase Details
Closed on
Jan 15, 2002
Sold by
Rendon Petra H and Rendon Rene T
Bought by
Wilke Wilke R and Wilke Angela D
Purchase Details
Closed on
Oct 17, 2000
Sold by
Butler Floyd R
Bought by
Wilke Wilke R and Wilke Angela D
Purchase Details
Closed on
Mar 23, 1999
Sold by
Butler Lela Maude Et Al - Life Es
Bought by
Wilke Wilke R and Wilke Angela D
Purchase Details
Closed on
Sep 19, 1997
Sold by
Butler Lela Maude Et Al - Life Es
Bought by
Wilke Wilke R and Wilke Angela D
Create a Home Valuation Report for This Property
The Home Valuation Report is an in-depth analysis detailing your home's value as well as a comparison with similar homes in the area
Home Values in the Area
Average Home Value in this Area
Purchase History
| Date | Buyer | Sale Price | Title Company |
|---|---|---|---|
| Wilke Wilke R | -- | -- | |
| Wilke Wilke R | -- | -- | |
| Wilke Wilke R | -- | -- | |
| Wilke Wilke R | -- | -- | |
| Wilke Wilke R | -- | -- | |
| Wilke Wilke R | -- | -- |
Source: Public Records
Tax History Compared to Growth
Tax History
| Year | Tax Paid | Tax Assessment Tax Assessment Total Assessment is a certain percentage of the fair market value that is determined by local assessors to be the total taxable value of land and additions on the property. | Land | Improvement |
|---|---|---|---|---|
| 2025 | $10,303 | $655,080 | $99,320 | $555,760 |
| 2024 | $8,714 | $576,870 | $99,320 | $477,550 |
| 2023 | $7,848 | $614,907 | $111,030 | $503,877 |
| 2022 | $9,945 | $540,492 | $50,000 | $490,492 |
| 2021 | $9,893 | $408,040 | $0 | $0 |
| 2020 | $10,026 | $408,040 | $50,000 | $358,040 |
| 2019 | $10,327 | $408,040 | $50,000 | $358,040 |
| 2018 | $10,120 | $401,430 | $50,000 | $351,430 |
| 2017 | $10,023 | $399,580 | $50,000 | $349,580 |
| 2016 | $9,396 | $374,580 | $25,000 | $349,580 |
| 2015 | $8,378 | $383,370 | $25,000 | $358,370 |
| 2014 | $8,375 | $382,090 | $25,000 | $357,090 |
| 2013 | $7,596 | $338,380 | $0 | $0 |
Source: Public Records
Map
Nearby Homes
- 1515 Barbara Ave
- 1531 Ray St
- 1610 Stonebridge Dr
- 1527 Butler Dr
- 4745 Karsten Creek Dr
- 4705 Wolf Creek Dr Unit 14
- 5018 Wolf Creek Dr Unit 3
- 4517 Old Stone Dr Unit 2
- 4518 Old Stone Dr Unit 2
- 4546 Old Stone Dr Unit 9
- 5313 Enclave Ct
- 5029 Wolf Creek Dr Unit 59
- 5030 Wolf Creek Dr Unit 6
- 5034 Wolf Creek Dr Unit 7
- 1675 Loop 306 Unit 1
- 4710 Shadow Creek Dr
- 5425 Riviera Ln
- 5441 Riviera Ln
- 1204 Sea Island Rd
- 5410 Lake Trail Ct
- 1527 Floyd Dr
- 1532 Barbara Ave
- 1535 Floyd Dr
- 1530 Floyd Dr
- 1530 Barbara Ave
- 1534 Barbara Ave
- 1526 Floyd Dr
- 1523 Floyd Dr
- 1526 Barbara Ave
- 1536 Barbara Ave
- 1534 Floyd Dr
- 1522 Floyd Dr
- 1519 Floyd Dr
- 1535 Barbara Ave
- 1541 Whitney St
- 1531 Barbara Ave
- 1537 Whitney St Unit 8
- 1537 Whitney St Unit 20
- 1537 Whitney St
- 1522 Barbara Ave