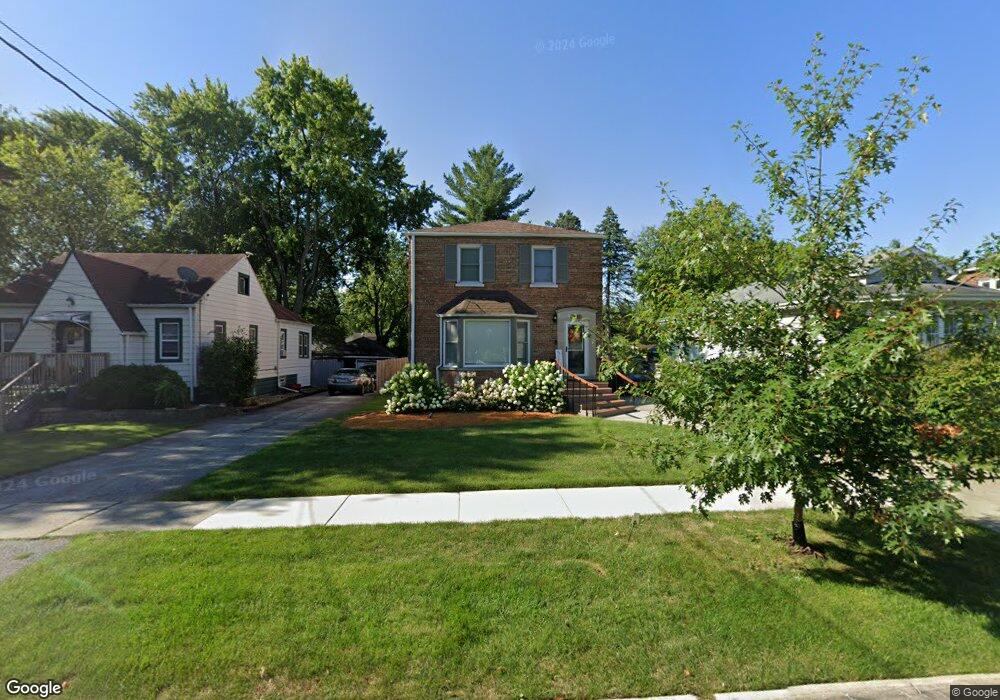
1531 Linden Rd Homewood, IL 60430
Estimated Value: $249,303 - $283,000
3
Beds
1
Bath
1,300
Sq Ft
$207/Sq Ft
Est. Value
About This Home
This home is located at 1531 Linden Rd, Homewood, IL 60430 and is currently estimated at $268,576, approximately $206 per square foot. 1531 Linden Rd is a home located in Cook County with nearby schools including Willow Elementary School, Winston Churchill School, and James Hart School.
Ownership History
Date
Name
Owned For
Owner Type
Purchase Details
Closed on
Sep 23, 2004
Sold by
Wuske Lawrence R and Mason Viola U
Bought by
Nelson Thornton Starr K
Current Estimated Value
Home Financials for this Owner
Home Financials are based on the most recent Mortgage that was taken out on this home.
Original Mortgage
$184,205
Outstanding Balance
$91,564
Interest Rate
5.93%
Mortgage Type
Unknown
Estimated Equity
$177,012
Purchase Details
Closed on
Jul 3, 2002
Sold by
Mason Viola U
Bought by
Wuske Lawrence R and Mason Viola U
Home Financials for this Owner
Home Financials are based on the most recent Mortgage that was taken out on this home.
Original Mortgage
$106,000
Interest Rate
6.8%
Purchase Details
Closed on
Oct 11, 1994
Sold by
Hoot Charles K and Hoot Sara B
Bought by
Mason Viola U
Home Financials for this Owner
Home Financials are based on the most recent Mortgage that was taken out on this home.
Original Mortgage
$117,950
Interest Rate
8.55%
Mortgage Type
FHA
Create a Home Valuation Report for This Property
The Home Valuation Report is an in-depth analysis detailing your home's value as well as a comparison with similar homes in the area
Home Values in the Area
Average Home Value in this Area
Purchase History
| Date | Buyer | Sale Price | Title Company |
|---|---|---|---|
| Nelson Thornton Starr K | $194,000 | -- | |
| Wuske Lawrence R | -- | -- | |
| Mason Viola U | $119,000 | -- |
Source: Public Records
Mortgage History
| Date | Status | Borrower | Loan Amount |
|---|---|---|---|
| Open | Nelson Thornton Starr K | $184,205 | |
| Previous Owner | Wuske Lawrence R | $106,000 | |
| Previous Owner | Mason Viola U | $117,950 |
Source: Public Records
Tax History Compared to Growth
Tax History
| Year | Tax Paid | Tax Assessment Tax Assessment Total Assessment is a certain percentage of the fair market value that is determined by local assessors to be the total taxable value of land and additions on the property. | Land | Improvement |
|---|---|---|---|---|
| 2024 | $7,578 | $21,000 | $3,360 | $17,640 |
| 2023 | $5,394 | $21,000 | $3,360 | $17,640 |
| 2022 | $5,394 | $13,476 | $2,940 | $10,536 |
| 2021 | $5,075 | $13,475 | $2,940 | $10,535 |
| 2020 | $5,023 | $13,475 | $2,940 | $10,535 |
| 2019 | $4,728 | $12,847 | $2,730 | $10,117 |
| 2018 | $4,574 | $12,847 | $2,730 | $10,117 |
| 2017 | $4,608 | $12,847 | $2,730 | $10,117 |
| 2016 | $5,143 | $12,855 | $2,520 | $10,335 |
| 2015 | $5,033 | $12,855 | $2,520 | $10,335 |
| 2014 | $4,964 | $12,855 | $2,520 | $10,335 |
| 2013 | $4,358 | $12,465 | $2,520 | $9,945 |
Source: Public Records
Map
Nearby Homes
- 1525 Burr Oak Rd
- 1624 Burr Oak Rd
- 1554 Olive Rd
- 1728 Olive Rd
- 1607 183rd St
- 1617 183rd St
- 1758 Pine Rd
- 17919 Homewood Ave
- 1214 Ridge Rd
- 1655 183rd St
- 18110 Center Ave
- 1750 183rd St
- 1852 Sycamore Rd
- 1406 Birch Rd
- 1850 Pine Rd
- 1741 Evergreen Rd
- 18243 Center Ave
- 1121 Olive Rd
- 18241 Gottschalk Ave
- 1208 Evergreen Rd