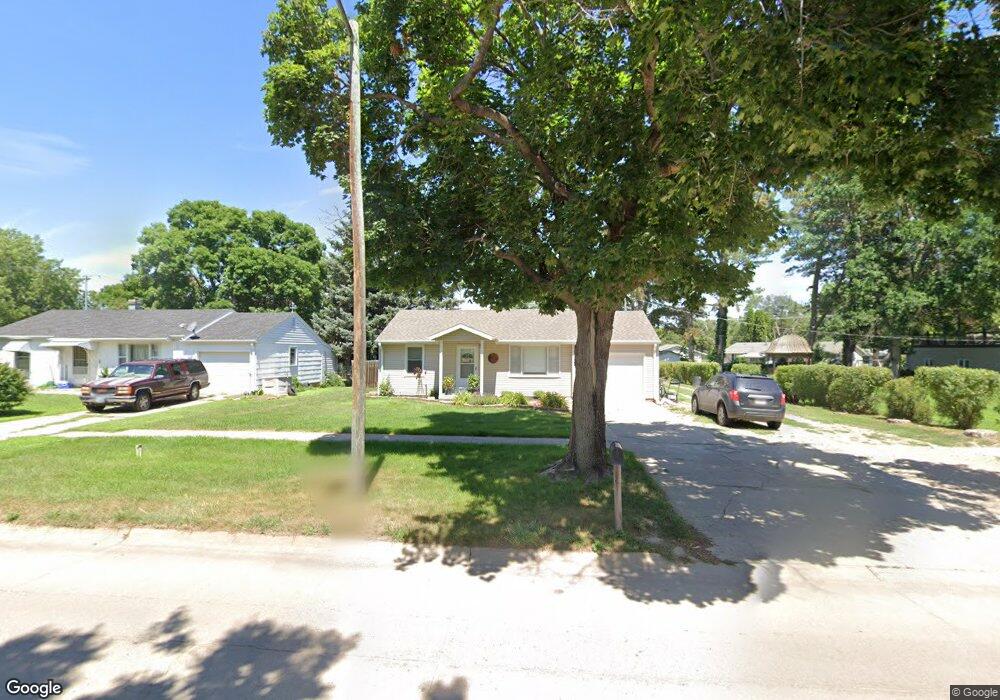
1531 Memorial Dr Broken Bow, NE 68822
Estimated Value: $137,465 - $188,000
Studio
2
Baths
984
Sq Ft
$167/Sq Ft
Est. Value
About This Home
This home is located at 1531 Memorial Dr, Broken Bow, NE 68822 and is currently estimated at $163,866, approximately $166 per square foot. 1531 Memorial Dr is a home located in Custer County with nearby schools including North Park Elementary School, Broken Bow Junior High School, and Broken Bow High School.
Ownership History
Date
Name
Owned For
Owner Type
Purchase Details
Closed on
Nov 26, 2025
Sold by
Reynolds Austin J and Reynolds Elizabeth
Bought by
Trew Roberta R
Current Estimated Value
Home Financials for this Owner
Home Financials are based on the most recent Mortgage that was taken out on this home.
Original Mortgage
$132,000
Outstanding Balance
$131,624
Interest Rate
6.27%
Mortgage Type
New Conventional
Estimated Equity
$32,242
Purchase Details
Closed on
May 30, 2019
Sold by
Reinbolt and Kimberly
Bought by
Reynolds Austin J
Purchase Details
Closed on
Dec 21, 2015
Sold by
Holcomb Michael D and Holcomb Rebecca S
Bought by
Holcomb Jacob K and Holcomb Chelsea J
Purchase Details
Closed on
Dec 2, 2011
Sold by
Motley Amber R
Bought by
Jensen Cory
Purchase Details
Closed on
Mar 27, 2008
Sold by
Franks Dorothy O Etal
Bought by
Motley Amber R
Create a Home Valuation Report for This Property
The Home Valuation Report is an in-depth analysis detailing your home's value as well as a comparison with similar homes in the area
Home Values in the Area
Average Home Value in this Area
Purchase History
| Date | Buyer | Sale Price | Title Company |
|---|---|---|---|
| Trew Roberta R | $187,662 | Russell Title & Escrow Co | |
| Reynolds Austin J | $110,000 | -- | |
| Holcomb Jacob K | $85,000 | -- | |
| Jensen Cory | $38,000 | -- | |
| Motley Amber R | $44,000 | -- |
Source: Public Records
Mortgage History
| Date | Status | Borrower | Loan Amount |
|---|---|---|---|
| Open | Trew Roberta R | $132,000 |
Source: Public Records
Tax History
| Year | Tax Paid | Tax Assessment Tax Assessment Total Assessment is a certain percentage of the fair market value that is determined by local assessors to be the total taxable value of land and additions on the property. | Land | Improvement |
|---|---|---|---|---|
| 2025 | $1,779 | $139,315 | $8,784 | $130,531 |
| 2024 | $1,568 | $114,373 | $8,784 | $105,589 |
| 2023 | $1,611 | $102,873 | $8,784 | $94,089 |
| 2022 | $1,759 | $95,860 | $8,784 | $87,076 |
| 2021 | $1,710 | $95,311 | $8,235 | $87,076 |
| 2020 | $1,695 | $95,311 | $8,235 | $87,076 |
| 2019 | $1,471 | $82,879 | $4,118 | $78,761 |
| 2017 | $1,476 | $80,849 | $4,118 | $76,731 |
| 2016 | $1,587 | $79,421 | $2,690 | $76,731 |
| 2015 | $861 | $42,726 | $2,657 | $40,069 |
| 2014 | $861 | $38,842 | $2,415 | $36,427 |
Source: Public Records
Map
Nearby Homes
Your Personal Tour Guide
Ask me questions while you tour the home.