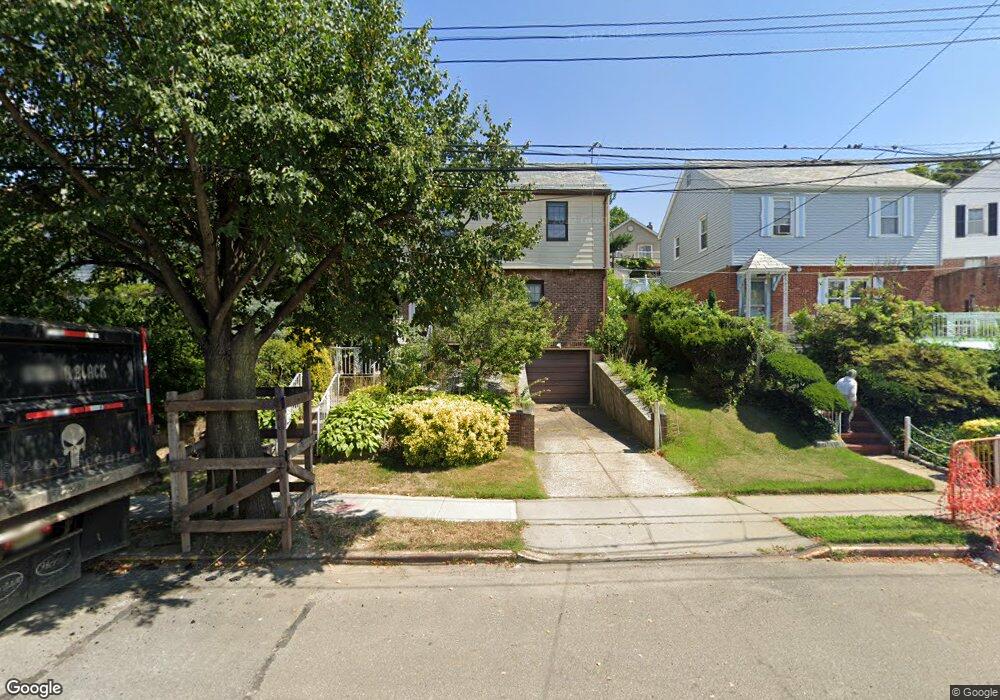
1531 Parsons Blvd Whitestone, NY 11357
Whitestone NeighborhoodEstimated Value: $965,980 - $1,148,000
3
Beds
2
Baths
4,360
Sq Ft
$243/Sq Ft
Est. Value
About This Home
This home is located at 1531 Parsons Blvd, Whitestone, NY 11357 and is currently estimated at $1,057,745, approximately $242 per square foot. 1531 Parsons Blvd is a home located in Queens County with nearby schools including P.S. 79 - Francis Lewis, Jhs 185 Edward Bleeker, and Flushing High School.
Ownership History
Date
Name
Owned For
Owner Type
Purchase Details
Closed on
Oct 9, 2009
Sold by
Kwon Chang S
Bought by
Choe Yong Jin and Choe Yousun
Current Estimated Value
Home Financials for this Owner
Home Financials are based on the most recent Mortgage that was taken out on this home.
Original Mortgage
$330,000
Outstanding Balance
$214,392
Interest Rate
5.14%
Mortgage Type
Purchase Money Mortgage
Estimated Equity
$843,353
Purchase Details
Closed on
Aug 9, 2007
Sold by
Guarino Alan and The Alfred D Oliveri And Roasaria C Ol
Bought by
Kwon Chang S
Home Financials for this Owner
Home Financials are based on the most recent Mortgage that was taken out on this home.
Original Mortgage
$102,750
Interest Rate
6.78%
Purchase Details
Closed on
Jun 5, 2002
Sold by
Oliveri Alfred D and Oliveri Rosaria
Bought by
Oliveri Alfred D (As Tr and Oliveri Rosaria C
Create a Home Valuation Report for This Property
The Home Valuation Report is an in-depth analysis detailing your home's value as well as a comparison with similar homes in the area
Home Values in the Area
Average Home Value in this Area
Purchase History
| Date | Buyer | Sale Price | Title Company |
|---|---|---|---|
| Choe Yong Jin | $610,000 | -- | |
| Choe Yong Jin | $610,000 | -- | |
| Kwon Chang S | $577,500 | -- | |
| Kwon Chang S | $577,500 | -- | |
| Oliveri Alfred D (As Tr | -- | -- | |
| Oliveri Alfred D (As Tr | -- | -- |
Source: Public Records
Mortgage History
| Date | Status | Borrower | Loan Amount |
|---|---|---|---|
| Open | Choe Yong Jin | $330,000 | |
| Closed | Choe Yong Jin | $330,000 | |
| Previous Owner | Kwon Chang S | $102,750 | |
| Previous Owner | Kwon Chang S | $410,000 |
Source: Public Records
Tax History
| Year | Tax Paid | Tax Assessment Tax Assessment Total Assessment is a certain percentage of the fair market value that is determined by local assessors to be the total taxable value of land and additions on the property. | Land | Improvement |
|---|---|---|---|---|
| 2025 | $10,017 | $51,058 | $13,746 | $37,312 |
| 2024 | $10,017 | $49,872 | $13,382 | $36,490 |
| 2023 | $9,499 | $47,294 | $12,026 | $35,268 |
| 2022 | $8,927 | $51,000 | $14,280 | $36,720 |
| 2021 | $8,958 | $51,120 | $14,280 | $36,840 |
| 2020 | $8,710 | $51,720 | $14,280 | $37,440 |
| 2019 | $8,401 | $54,180 | $14,280 | $39,900 |
| 2018 | $7,737 | $39,412 | $9,542 | $29,870 |
| 2017 | $7,296 | $37,263 | $11,503 | $25,760 |
| 2016 | $6,781 | $37,263 | $11,503 | $25,760 |
| 2015 | $4,020 | $35,457 | $14,066 | $21,391 |
| 2014 | $4,020 | $34,634 | $14,077 | $20,557 |
Source: Public Records
Map
Nearby Homes
- 15-43 144th St
- 1537 144th St
- 145-04 14th Ave
- 14712 15th Dr
- 1352 145th Place
- 16-11 149th St
- 149-20 17th Ave
- 1535 149th St
- 1527 149th St
- 14940 15th Dr
- 2023 Whitestone Expy
- 1620 150th St
- 21-12 144th St
- 149-16 14th Ave
- 150-27 16th Rd
- 13-22 140th St
- 150-29 16th Rd
- 22-01 149th St
- 15040 16th Rd
- 14315 22nd Rd
- 1535 Parsons Blvd
- 1527 Parsons Blvd
- 1527 Parsons Blvd
- 15-23 Parsons Blvd
- 1523 Parsons Blvd
- 1539 Parsons Blvd
- 1534 145th Place
- 1530 145th Place
- 1538 145th Place
- 1534 145th Place
- 1519 Parsons Blvd
- 1526 145th Place
- 15-42 145th Place
- 1522 145th Place
- 1544 145th Place
- 1515 Parsons Blvd
- 15-15 Parsons Blvd
- 1530 Parsons Blvd
- 1536 Parsons Blvd
- 1544 145th Place
Your Personal Tour Guide
Ask me questions while you tour the home.