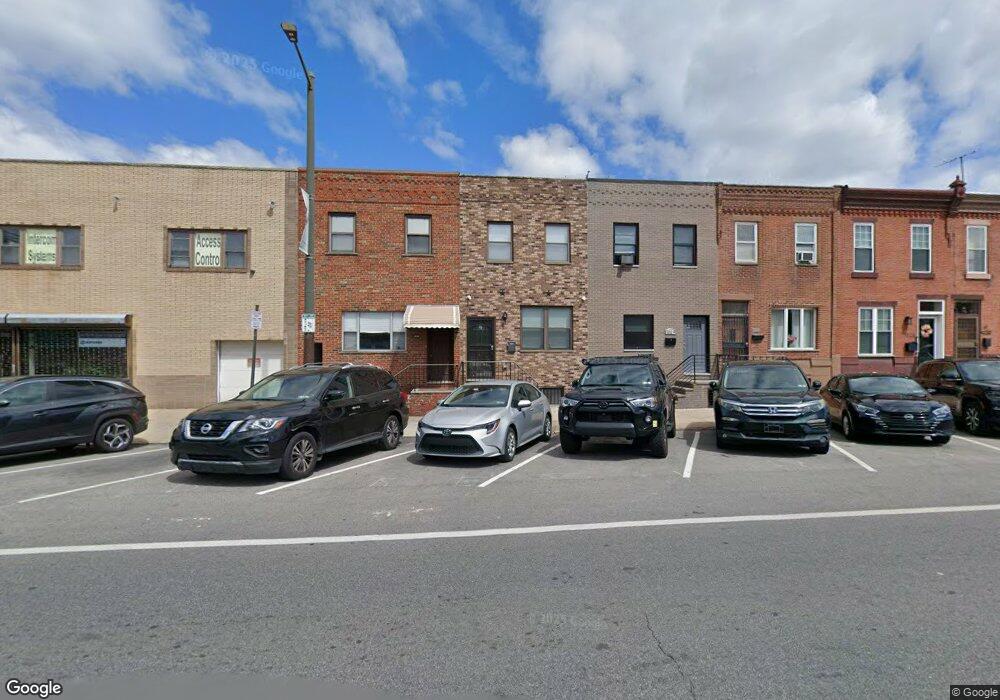
1531 W Passyunk Ave Philadelphia, PA 19145
South Philadelphia West NeighborhoodEstimated Value: $280,000 - $348,000
3
Beds
1
Bath
1,500
Sq Ft
$212/Sq Ft
Est. Value
About This Home
This home is located at 1531 W Passyunk Ave, Philadelphia, PA 19145 and is currently estimated at $317,369, approximately $211 per square foot. 1531 W Passyunk Ave is a home located in Philadelphia County with nearby schools including Stephen Girard School, Philadelphia Performing Arts Charter School, and Universal Vare Charter School.
Ownership History
Date
Name
Owned For
Owner Type
Purchase Details
Closed on
Aug 8, 2019
Sold by
Phl Builders Llc
Bought by
Duong Lan My
Current Estimated Value
Home Financials for this Owner
Home Financials are based on the most recent Mortgage that was taken out on this home.
Original Mortgage
$227,500
Interest Rate
3.9%
Mortgage Type
Commercial
Purchase Details
Closed on
Jul 8, 2019
Sold by
Abate Pio and Varano Elizabeth
Bought by
Phl Builders Llc
Home Financials for this Owner
Home Financials are based on the most recent Mortgage that was taken out on this home.
Original Mortgage
$227,500
Interest Rate
3.9%
Mortgage Type
Commercial
Purchase Details
Closed on
Dec 24, 2007
Sold by
Varano Elizabeth and Estate Of Rosina Varano
Bought by
Abate Pio and Varano Elizabeth
Purchase Details
Closed on
Feb 25, 1998
Sold by
Varano Rosina and Estate Of Maria Teresa Varano
Bought by
Varano Rosina and Varano Elizabeth
Create a Home Valuation Report for This Property
The Home Valuation Report is an in-depth analysis detailing your home's value as well as a comparison with similar homes in the area
Home Values in the Area
Average Home Value in this Area
Purchase History
| Date | Buyer | Sale Price | Title Company |
|---|---|---|---|
| Duong Lan My | $190,000 | First City Abstract Agcy Inc | |
| Phl Builders Llc | $130,000 | Springfield Abstract Inc | |
| Abate Pio | $23,125 | None Available | |
| Varano Rosina | -- | -- |
Source: Public Records
Mortgage History
| Date | Status | Borrower | Loan Amount |
|---|---|---|---|
| Closed | Phl Builders Llc | $227,500 |
Source: Public Records
Tax History Compared to Growth
Tax History
| Year | Tax Paid | Tax Assessment Tax Assessment Total Assessment is a certain percentage of the fair market value that is determined by local assessors to be the total taxable value of land and additions on the property. | Land | Improvement |
|---|---|---|---|---|
| 2025 | $3,947 | $269,000 | $53,800 | $215,200 |
| 2024 | $3,947 | $269,000 | $53,800 | $215,200 |
| 2023 | $3,947 | $282,000 | $56,400 | $225,600 |
| 2022 | $1,622 | $237,000 | $56,400 | $180,600 |
| 2021 | $2,252 | $0 | $0 | $0 |
| 2020 | $2,252 | $0 | $0 | $0 |
| 2019 | $2,094 | $0 | $0 | $0 |
| 2018 | $1,391 | $0 | $0 | $0 |
| 2017 | $1,391 | $0 | $0 | $0 |
| 2016 | $1,391 | $0 | $0 | $0 |
| 2015 | $1,332 | $0 | $0 | $0 |
| 2014 | -- | $99,400 | $17,051 | $82,349 |
| 2012 | -- | $10,400 | $3,085 | $7,315 |
Source: Public Records
Map
Nearby Homes
- 1941 S Hicks St
- 2123 S Mole St
- 1928 S 15th St
- 1920 S 16th St
- 2142 S Hicks St
- 1912 S 15th St
- 2101 S 17th St Unit 710
- 2101 S 17th St Unit 401
- 2136 S Bancroft St
- 1425 Jackson St
- 1844 S 16th St
- 1836 S Hicks St
- 1840 S Mole St
- 2225 S Hicks St
- 2224 S Rosewood St
- 1942 S Bouvier St
- 1327 Snyder Ave
- 1830 S 17th St
- 1827 S Rosewood St
- 1800 2 S 16th St Unit B
- 1529 W Passyunk Ave
- 1533 W Passyunk Ave
- 1527 W Passyunk Ave
- 1525 W Passyunk Ave
- 1523 W Passyunk Ave
- 1521 W Passyunk Ave
- 1532 Emily St
- 1530 Emily St
- 1528 Emily St
- 1526 Emily St
- 1534 Emily St
- 1519 W Passyunk Ave
- 1536 Emily St
- 1538 Emily St
- 1524 Emily St
- 1540 Emily St
- 1517 W Passyunk Ave
- 1515 W Passyunk Ave
- 1515 W Passyunk Ave Unit FIRST
- 1545 W Passyunk Ave