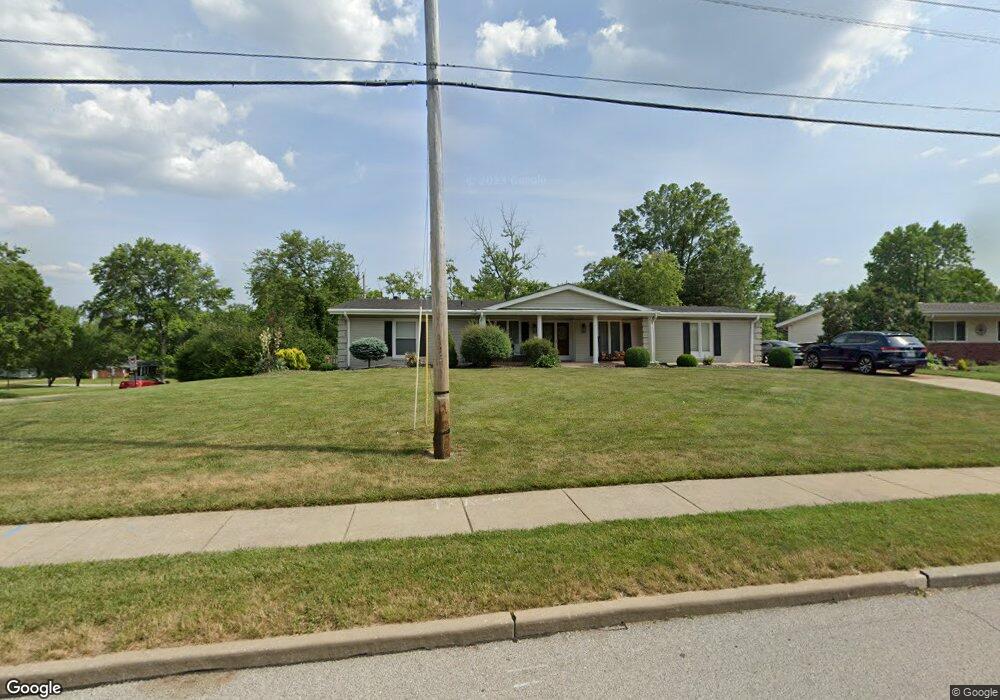
15310 Clayton Rd Ballwin, MO 63011
Estimated Value: $421,556 - $509,000
4
Beds
3
Baths
2,140
Sq Ft
$213/Sq Ft
Est. Value
About This Home
This home is located at 15310 Clayton Rd, Ballwin, MO 63011 and is currently estimated at $456,389, approximately $213 per square foot. 15310 Clayton Rd is a home located in St. Louis County with nearby schools including Claymont Elementary School, Parkway West Middle School, and Parkway West High School.
Ownership History
Date
Name
Owned For
Owner Type
Purchase Details
Closed on
Feb 10, 2012
Sold by
Thomas Jacob and Thomas Nirmala T
Bought by
Hicks Cory D and Hicks Chrystal
Current Estimated Value
Home Financials for this Owner
Home Financials are based on the most recent Mortgage that was taken out on this home.
Original Mortgage
$158,867
Outstanding Balance
$111,464
Interest Rate
4.4%
Mortgage Type
FHA
Estimated Equity
$344,925
Purchase Details
Closed on
Sep 7, 2002
Sold by
Thomas Nirmala T and Thomas Jacob
Bought by
State Of Missouri and Missouri Highways & Transportation Commi
Purchase Details
Closed on
Dec 3, 1999
Sold by
Catapano Frank Scott and Catapano Susan M
Bought by
Thomas Jacob and Thomas Nirmala T
Home Financials for this Owner
Home Financials are based on the most recent Mortgage that was taken out on this home.
Original Mortgage
$144,625
Interest Rate
7.95%
Purchase Details
Closed on
Sep 23, 1999
Sold by
Wall James M and Wall Diane L
Bought by
Catapano Frank Scott
Create a Home Valuation Report for This Property
The Home Valuation Report is an in-depth analysis detailing your home's value as well as a comparison with similar homes in the area
Home Values in the Area
Average Home Value in this Area
Purchase History
| Date | Buyer | Sale Price | Title Company |
|---|---|---|---|
| Hicks Cory D | $163,000 | Lafayette Title Company | |
| State Of Missouri | $14,000 | -- | |
| Thomas Jacob | $170,500 | -- | |
| Catapano Frank Scott | $119,000 | -- |
Source: Public Records
Mortgage History
| Date | Status | Borrower | Loan Amount |
|---|---|---|---|
| Open | Hicks Cory D | $158,867 | |
| Previous Owner | Thomas Jacob | $144,625 |
Source: Public Records
Tax History
| Year | Tax Paid | Tax Assessment Tax Assessment Total Assessment is a certain percentage of the fair market value that is determined by local assessors to be the total taxable value of land and additions on the property. | Land | Improvement |
|---|---|---|---|---|
| 2025 | $4,555 | $74,250 | $33,930 | $40,320 |
| 2024 | $4,555 | $70,340 | $22,040 | $48,300 |
| 2023 | $4,491 | $70,340 | $22,040 | $48,300 |
| 2022 | $3,908 | $55,590 | $18,350 | $37,240 |
| 2021 | $3,885 | $55,590 | $18,350 | $37,240 |
| 2020 | $3,603 | $48,820 | $17,770 | $31,050 |
| 2019 | $3,562 | $48,820 | $17,770 | $31,050 |
| 2018 | $3,343 | $42,490 | $16,000 | $26,490 |
| 2017 | $3,248 | $42,490 | $16,000 | $26,490 |
| 2016 | $2,641 | $32,810 | $11,720 | $21,090 |
Source: Public Records
Map
Nearby Homes
- 78 Meadowbrook Country Club Estate
- 351 Greenbriar Ln
- 623 Kenilworth Ln
- 27 Meadowbrook Country Club Estate
- 1019 Claytonbrook Dr Unit 1019
- 313 Providence Rd
- 916 Claytonbrook Dr Unit 1
- 922 Claytonbrook Dr Unit 1
- 30 Meadowbrook Country Club Estate
- 1026 Kehrs Mill Rd Unit 4
- 927 Claytonbrook Dr Unit 3
- 1050 Kehrs Mill Rd
- 609 Log Hill Ct
- 2316 Coventry Farm Ct
- 435 Holly Terrace Ct
- 222 Dale Ct
- 239 E Skyline Dr
- 103 Denbigh Terrace
- 53 Log Hill Ln
- 323 Chipley Cir
- 15314 Clayton Rd
- 828 Westwood Dr
- 830 Westwood Dr
- 15318 Clayton Rd
- 15280 Clayton Rd
- 832 Westwood Dr
- 826 Westwood Dr
- 15324 Clayton Rd
- 15276 Clayton Rd
- 823 Westwood Dr
- 825 Westwood Dr
- 824 Westwood Dr
- 827 Westwood Dr
- 836 Westwood Dr
- 860 Claymont Dr
- 15330 Clayton Rd
- 15272 Clayton Rd
- 857 Claymont Dr
- 838 Westwood Dr
- 835 Westwood Dr
Your Personal Tour Guide
Ask me questions while you tour the home.